H. Lohninger and J. Ofner
Institute of Chemical Technologies and Analytics, Vienna University of Technology, Vienna, Austria
Introduction
Today, trends in chemical analysis tend more and more towards chemical structure determination of micro- or nano-structured materials using various spectroscopic and other imaging techniques [e.g. scanning electron microscopy-energy dispersive X-ray (SEM-EDX), Raman, mass, terahertz (THz), Fourier transform infrared (FT-IR), secondary ion mass spectrometry (SIMS), inductively coupled plasma mass spectrometry (ICP/MS), inductively coupled plasma optical emission spectrometry (ICP/OES) etc.]. However, an unequivocal determination of the components of many complex environmental, medical or industrial samples is barely possible by using only a single imaging technique. Thus the combination data from several complementary spectroscopic techniques seems to be becoming increasingly important, especially as spectroscopic imaging technology has evolved during recent years, both in speed and resolution.
Most software packages bundled with the instruments do not allow one to combine data from instruments of other manufacturers, requiring the researcher to write proprietary code for the multivariate data (chemometric) analysis of multisensor data.
ImageLab,1 a newly developed imaging software, has been designed to allow the combined analysis of the hyperspectral data obtained from different imaging techniques. This multisensor approach supports an image-based structure determination using complementary information to identify individual constituents of a sample.
Within this article, we discuss a few basic aspects of multisensor hyperspectral imaging, the advantages of a descriptor-based processing of the data and the capabilities of ImageLab. Finally, an example of the analysis of a multisensor hyperspectral image of a complex environmental sample is given.
Fusing multisensor images
While multisensor imaging is well-known and has been performed for more than a decade in medical applications,2 there is still a lack of general purpose software allowing one to compile multisensor images into a single dataset and supporting the joint analysis of the various sensor input signals. Various approaches of (semi-)automated fusion algorithms have been developed and tested in recent years. Most of these approaches try to automatically align images from different sensors (e.g. radar and visible light) assuming that part of the information is visible in both spectral domains. While this is true for many surveillance images, this is not necessarily true for images obtained from spectroscopic techniques delivering mutually exclusive information. In such cases automated image fusion is quite demanding and prone to errors. We have therefore developed a scheme based on a reference photo which is common to all the spectral images to be fused.
In general, fusing multisensor images is subject to the following main problems: (1) data formats of various spectroscopic devices are different, (2) the instruments used to obtain the images normally have different spatial resolutions, (3) the images exhibit different orientations of a sample and (4) the spectral domains may show little information in common. While the first problem is mainly a practical problem (which can be quite annoying given that some manufacturers of imaging instruments do not fully support the export of the image data in an easily readable format), problems (2) to (4) are much more demanding.
Assuming that the images exhibit a linear spatial relationship to each other (i.e. there is no non-linear distortion, which is true for most practical purposes) we simply have to find the transformation matrices which project all images to be combined onto a common reference grid. One possible way to achieve this is to create calibrated images which are referenced to a photo (or a map or some other kind of reference grid) which is common to all spectral domains. When dealing with microscopic hyperspectral images, this can be easily achieved by taking a photo in the visual range of light. Each of the hyperspectral images can then be calibrated by specifying several reference points, both in the hyperspectral image and the photo. Each of the transformation matrices is then calculated by multilinear regression.
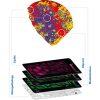
After having established the calibration equations the final step of fusing is achieved by projecting the individual hyperspectral images into a common space, resulting in a hypercube where the pixels of the various spectral components are aligned on top of each other (Figure 1).
<>.")
At this point we have to deal with those parts of the combined image which lack data in some spectral domains due to partial overlap of the original images. It is particularly important to mark these partial regions in order to be able to exclude the corresponding pixels from statistical processing which may require valid inputs from all spectral regions.
Raw data or spectral descriptors?
Another important aspect of multisensor imaging is the statistical interpretation of the data. Although most researchers tend to use the available raw data for the development of multivariate models in order to interpret the data, we recommend not to use the raw data itself but instead to introduce spectral descriptors which specify and extract particular information from the data. The definition and usage of spectral descriptors is a simple and efficient way: (1) to cope with the curse of dimensionality in multivariate data analysis, and (2) to improve the information structure in the data space. Both the reduction of the dimensionality of the independent variable space and the improved data structure contribute to better multivariate data models and faster calculations.
In order to explain the motivation behind the preference of using spectral descriptors instead of raw data let us discuss a few aspects of this approach in more detail. First, the well-known curse of dimensionality3 automatically results in an almost empty feature space which may reduce the effectiveness of multivariate data models considerably. Despite the fact that in imaging the number of “samples” (i.e. the number of pixels of an image) is significantly higher than in classical (i.e. chemical) analysis, the feature space is still almost empty. For example, if you acquire spectra with 300 intensities measured along the wavelength axis, the feature space contains about 10600 cells (assuming that the intensity is measured with a resolution of 1%). Assuming further that the image consists of 200 × 200 pixels, we have 40,000 samples—which is almost nothing compared to the huge size of the feature space.
This empty space may (and most probably will) result in poor quality of multivariate classifiers. And even further, it is hard to test the quality of this classifier, as it is impossible to fill this space with a reasonable number of evenly distributed samples. Thus it is a good idea to reduce the size of the feature space by focusing on variables which contain information relevant to the investigated problem. At this point variable selection methods may help, but will not entirely resolve the problems.
The second aspect which must not be overlooked is the chemical knowledge which is contained within the data, but which is blurred over the huge feature space. This knowledge can be “concentrated” in the feature space by both reducing the size of the space and by transforming the space in a way so that chemical knowledge is encoded by derived variables (“spectral descriptors”).
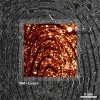
A small practical example should clarify the situation: Figure 2 shows the images obtained from an environmental sample analysed by a Raman spectroscopy microscope.
; centre: image obtained by integrating the intensities between 2840 cm–1 and 3033 cm–1; right: image obtained by correlating a triangle template peak with the spectrum. It can be clearly seen that the correlation descriptor is much more selective than the other two approaches.")
At the left the image resulting from raw intensities at 2917 cm–1 is displayed, the centre image shows the results from integration over the peak around 2917 cm–1, while the right picture shows the image obtained by calculating the correlation to a template peak. This template peak is an idealised spectral peak, representing a certain class of substances (i.e. the band caused by stretching modes of CH-containing compounds).
In the first and the second cases one easily recognises several more or less blurred spots in the images. Looking at the spectra of two of these spots, we can see the difference between these two spectra. At location L1 there is a clear peak around 2917 cm–1, while at spot L2 there are fluctuations originating from a broad underlying peak and/or excessive noise.
The idea behind spectral descriptors can now be used to encode the knowledge that a peak occurring at 2917 cm–1 with a certain width may (and certainly will) have a special meaning related to the class of substances (i.e., in this case, aliphatic compounds). So if we calculate the correlation of all spectra with a template spectrum containing only this single idealised peak, we end up with an image which shows only a single large spot around L1. And indeed, further analysis shows that this very spot is different from all the other spots, containing organic substances, while the rest of the particles consist mostly of inorganic substances.
ImageLab—A general software solution for multisensor imaging
ImageLab is an MS Windows™-based multisensor imaging system for processing and analysing hyperspectral images.1 It has been designed to cope with the above mentioned problems of multisensor imaging. The principal idea behind ImageLab is to support as many different spectroscopic techniques as possible. In order to achieve this ImageLab implements the concept of (user- defined) import filters which are specifically designed to import the measured data from various imaging devices. The only restriction for the import filters is based on the necessity of being able to access the data generated by the device. In many cases this data access can be performed via text formats resulting in simple and easy to implement import filters.
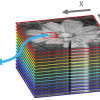
ImageLab is a modular system consisting of a base engine, a graphical user interface, a chemometrics toolbox and optional user-supplied modules. It supports the most important spectroscopic imaging techniques, such as ultraviolet-visible, infrared, Raman, terahertz, optical emission/absorption, energy dispersive X-ray and mass spectrometry. Further, ImageLab allows one to combine hyperspectral images with maps of physical properties and conventional high-resolution colour photos (see Figure 3).

A wealth of built-in multivariate statistical methods provides the capability to analyse and classify acquired hyperspectral images. Among these are: MLR (multiple linear regression), PCA (principal component analysis), HCA (hierarchical cluster analysis), similarity maps and PLS/DA (partial least squares discriminant analysis).
All images—either images of raw data or images resulting from statistical analyses—can be combined with conventional photos by utilising an image stack. The image stack can be used to blend up to eight layers into a single image using different algorithms and levels of transparency. Thus analytical information can be highlighted directly in the corresponding photo, making it much easier to recognise areas of interest.
In addition, ImageLab provides several tools to pre-process and improve raw image data. Images may be cut, resampled, mirrored and masked. A bad pixel detector helps to identify pixels which are invalid due to problems with, for example, the detector. On the spectral data processing side, the most important tools, such as baseline subtraction, smoothing, the calculation of derivative spectra, and many more are included. Further, ImageLab provides a versatile and open programming interface allowing researchers to hook up their own data processing modules (written in any language which allows access to the local disk and to create executables). This concept of user-defined modules can also be used to develop data import modules for any spectroscopic device.
Application example
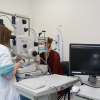
In order to demonstrate the benefits of multisensor imaging for analytical purposes, an example of its application to complex environmental samples is given. Western Australian salt lakes exhibit formation of ultra-fine particles, which are supposed to precipitate rain. To study the diversity of organic and inorganic particles at these salt lakes, the German Research foundation has funded three measurement campaigns in the so-called Wheat Belt. Particles from 250 nm to several microns have been collected by impaction. Subsequently, images have been acquired using high-resolution electron-microscopy, energy dispersive X-ray (SEM-EDX) and Raman spectroscopy to unravel the complex composition of the samples.4
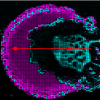
The information obtained from these imaging techniques is complementary. SEM provides a high-resolution image for studies of the morphology, EDX delivers the elemental composition and finally the Raman spectroscopic imaging provides vibrational information of organic and inorganic species. While, for example, NaCl is only visible in the EDX image, volatile organics on the other hand are only visible in the Raman image. Other species, e.g. CaSO4 or silicates, can only be verified unquestionably using both techniques, where the elemental composition supports the assignment of vibrational bands. We constructed several classifiers with different selectivities, e.g. being selective for sodium chloride, calcium sulfate, silicates, soot and organic substances exhibiting CH bonds. The complex mixture of the precipitated aerosol could be unravelled by analysing the combined hyperspectral datasets, using a descriptor-based approach (see Figure 4).
 shows NaCl (violet), image (b) shows soot (red) and organic compounds (yellow), and image (c) displays calcium sulfate (blue) and silicates (green). An interesting particle can be seen in the centre of the upper half of each image (see inset in the bottom row). This particle consists of a sodium chloride crystal, some silicate, and some calcium sulfate. The right half of the particle is covered by organic material.")
In addition to the commonly used bulk analysis with mass closure calculations, multisensor hyperspectral imaging provides a more detailed understanding of mixing and interlinking of different aerosol constituents. For this example, the coating of inorganic particles such as NaCl, CaSO4 and silicates by semi-volatile organic species could be ascertained.
Conclusion
Multisensor hyperspectral imaging proves to be a versatile tool for the spatially resolved chemical analysis of complex samples. As demonstrated above, the combination of multiple imaging techniques provides access to a deeper understanding of the chemical nature of complex environmental samples such as aerosols. Compared to established methods of aerosol analysis, additional morphological and chemical information can be acquired. Thus, multisensor imaging, using Raman spectroscopy and SEM/EDX in our case, significantly assisted the interpretation of the samples. ImageLab proved to be a valuable tool for the analysis of multisensor hyperspectral data and opened the door to a fast and efficient analysis of such data.
Acknowledgements
The authors would like to thank Katharina A. Kamilli, Andreas Held (University of Bayreuth) and the German Research Foundation (DFG RU 763—HALOPROC) for providing the samples from Western Australia. Further, the authors thank Elisabeth Eitenberger and Gernot Friedbacher (Vienna University of Technology) for the SEM-EDX imaging, as well as Bernhard Lendl (Vienna University of Technology) for the access to the Raman imaging system.
References
1. ImageLab—Multisensor Image Analysis, www.imagelab.at
2. A.P. James and B.V. Dasarathy, “Medical image fusion: A survey of the state of the art”, Inform. Fusion 19, 4–19 (2014). doi: http://dx.doi.org/10.1016/j.inffus.2013.12.002
3. R.E. Bellman, Adaptive Control Processes. Princeton University Press (1961).
4. K.A. Kamilli, J. Ofner, T. Krause, T. Sattler, E. Eitenberger, G. Friedbacher, B. Lendl, H. Lohninger, H. Schöler and A. Held, Atmospheric Chemistry and Physics, to be submitted (2014).