James A. Hurst, John A. Volpato and Gregory E. O’Donnell
Chemical Analysis Branch, TestSafe Australia, WorkCover NSW, 5A Pioneer Ave., Thornleigh, NSW 2120, Australia. E-mail: [email protected]
Introduction
Industrial environments pose potentially hazardous situations whereby workers may be exposed to various airborne toxic elements in their breathing zone. One of the main aerosol fractions of interest is welding fume. Of the major types of welding, there are approximately 20 procedures used. Two of the more common techniques are manual metal arc welding and gas metal arc welding.1 Toxic fume elements arise from the flux and core metal as well as the welding surface. During occupational hygiene investigations, it is necessary to monitor such toxic elements and relate the levels found in the workplace to relevant exposure standards such as the American Conference of Governmental Industrial Hygienists (ACGIH) Threshold Limit Values (TLV) or other regulatory authority values. Welding fume is typically respirable and less than 1 µm in diameter, although particle agglomeration may occur. In Australia, welding fumes are sampled according to Australian Standard AS3853.1-2006.2 This standard determines personal exposure by giving a total gravimetric determination of the mass of welding fume collected on membrane filters for a known volume of air sampled. It must be noted that larger particles may also be collected because welding processes may involve related operations such as grinding.
The filters can be further characterised by determining the elemental concentration of the welding fume collected. This can readily be done by X-ray fluorescence (XRF) spectrometry. Whilst measurements are easily performed, calibration and sample collection strategies can have a significant effect on the analytical results. When thin layer dust or fume samples are collected on membrane filters there is a linear relationship between count rate and elemental loading. Two main factors may cause this relationship to break down. These are: first, absorption and enhancement effects and second, particle size effects. Absorption effects occur with increasing sample loading and are the main cause of deviation from linearity. Enhancement effects may happen when elements measured are excited by fluorescence from nearby major elements in the matrix. Both effects are more pronounced for light elements and, therefore, restrict usable sample loadings. For a typical measurement of Ti in a matrix of Fe, this loading limit would be around 2 mg per 25 mm filter. Particle size effects are also worse for the lighter elements and occur because dust or fume loadings are not necessarily homogeneous. Hence, individual particles, when significantly large enough, will absorb radiation to a greater or lesser extent, depending on the mass absorption coefficients causing the linear relationship to break down. Fortunately, elements of occupational interest are those with atomic numbers greater than Ti and these effects are not significant, provided the thin layer condition is maintained. For light elements, there are, however, involved procedures for dealing with overloaded filters and particle size effects. Other considerations are the type of collection filter, uniformity of deposition on the collection filter and dust falling off the filter. In addition, spectral interferences such as line overlaps also need to be considered.
Most methods generally use conventional calibrations such as those based on MDHS91,3 OSHA ID-2044 or the discontinued NIOSH 7200. The filter media is analysed directly by XRF spectrometry with little sample preparation other than the mounting of the filter. Elements of occupational hygiene interest generally range from Ti (Z = 22) to Pb (Z = 82). This includes those that are of particular interest in welding fume such as Ni, Fe, Mn and Cr. Calibration of the XRF can be achieved by gravimetrically making dust generated standards that are prepared using the same type of sampling head as used in the field, which allows the deposition pattern of the dust on the standard to be matched with the samples. Alternatively, other procedures have included applying metal solutions or suspensions to filter paper and allowing the solvent or liquid to evaporate, preparing metal precipitates using complexing agents including dithiocarbamates or using ion exchange filter papers.
Analytical procedure
A PANalytical 2.4 kW Axios wavelength dispersive XRF spectrometer with rhodium tube, operated under vacuum, was used for all measurements. Instrumental settings included fine collimation, 25 mm channel mask, scintillation or flow counter detection. A LiF200 dispersion crystal was used for most elements except for Sn and Cd that used LiF220.
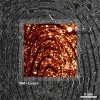
For each of the elements measured, eight standards were prepared up to a loading of around 1000 µg per element. The respective oxides of the elements were mainly used. The elements prepared ranged from Ti to Pb and the dust was collected on 25 mm poly(vinyl chloride) (PVC) membrane filters. Other membrane filters such as polycarbonate or cellulose acetate can be used but there tends to be issues with static charge for the polycarbonate filter and gravimetric instability for the cellulose acetate filter. An unused PVC filter was used as a blank. Standards were prepared using a closed dust generation apparatus similar to that used to prepare respirable quartz standards.5 The dust generation apparatus is shown in Figure 1. With the pump turned on, and by quickly opening the puffer tube inside the vessel, a burst of incoming air created a cloud of dust. Using pre-weighed filters in the sampling head to collect the dust and then post-weighing them, elemental dust loaded standards could be prepared. The collection times were varied to obtain different dust loadings. A modified United Kingdom Atomic Energy Authority (UKAEA) inhalable dust sampling head (seven-hole) was used along with a personal sampling pump operated at 2 ± 0.2 L min–1. The prepared standards were mounted in 50 mm aluminium rings using Kapton polyimide film to sandwich the filter and then analysed by XRF. Total analysis time was approximately 11 minutes. Drift correction was applied and line overlap corrections made. Matrix corrections were not used and it was assumed that differences between dust and welding fume with respect to particle size would not present a problem because elements heavier than Ti were measured. A square root weighted calibration for the elements was undertaken to focus more on the lower concentration standards and the resulting regression data for all elements are shown in Table 1. This table also gives the statistical detection limit and limit of quantitation.

Filter samples were mounted between the Kapton film prior to analysis and a typical arrangement is shown in Figure 2.

Table 1. Calibration data for welding fume program.
Channel | Slope | y Intercept | Background c s–1 | K µg | Time | r2 | LOD | LOQ |
SnKa | 16 | 2 | 323.9 | 5.8 | 60 | 0.9993 | 0.40 | 2.0 |
CdKa | 2 | 0 | 7.8 | 6.6 | 60 | 0.9993 | 0.44 | 2.2 |
MoKa | 350 | –42 | 611.4 | 4.4 | 8 | 0.9998 | 0.07 | 0.4 |
PbLa | 110 | 20 | 485.6 | 10.5 | 20 | 0.9994 | 0.13 | 0.6 |
AsKa | 66 | 3 | 440.7 | 7.8 | 32 | 0.9990 | 0.16 | 0.8 |
SeKa | 382 | –23 | 408.9 | 7.7 | 16 | 0.9988 | 0.04 | 0.2 |
ZnKa | 405 | 144 | 445.5 | 7.3 | 12 | 0.9997 | 0.04 | 0.2 |
WLa | 40 | –3 | 124.7 | 6.2 | 24 | 0.9995 | 0.16 | 0.8 |
CuKa | 163 | 168 | 334.3 | 6.3 | 12 | 0.9979 | 0.09 | 0.5 |
NiKa | 196 | 26 | 174.9 | 2.6 | 12 | 0.9996 | 0.06 | 0.3 |
CoKa | 187 | 2 | 142.8 | 4.6 | 12 | 0.9985 | 0.05 | 0.3 |
FeKa | 215 | 135 | 324.1 | 10.3 | 12 | 0.9972 | 0.07 | 0.3 |
MnKa | 209 | 17 | 141.0 | 4.7 | 12 | 0.9971 | 0.05 | 0.2 |
CrKa | 201 | 27 | 123.1 | 10.1 | 12 | 0.9986 | 0.05 | 0.2 |
VKa | 168 | 6 | 82.0 | 6.1 | 12 | 0.9992 | 0.04 | 0.2 |
TiKa | 146 | 17 | 71.9 | 9.1 | 12 | 0.9987 | 0.05 | 0.2 |
LOD = Limit of detection at the 95% confidence limits.
LOQ = Limit of quantitation (10 Standard deviations on background).
K = Weighted root mean square deviation from calibration line.
r2 = Coefficient of determination.
Evaluation of method
In view of the fact that calibration standards for welding fume are generally not commercially available, procedures using atomic absorption spectrophotometry (AAS) to check XRF standards and samples are sometimes used. This, and other techniques, however, may have their own difficulties. It is therefore good practice if samples can be obtained and analysed as part of proficiency programmes to evaluate analytical methods. Unfortunately, a number of proficiency programmes only use aqueous spiked filters that are not really adequate for method evaluation. Therefore, it is desirable to analyse real welding fume samples. Samples obtained from the inter-laboratory proficiency programme operated by the Health and Safety Laboratory (HSL) in the UK, known as the Workplace Analysis Scheme for Proficiency (WASP) programme for welding fumes, meet this criterion and were analysed by the XRF method. These proficiency programme samples were prepared by the HSL using a multi-port sampler and real welding fume to produce analytes in a complex welding fume matrix. The elements determined were Ni, Fe, Mn and Cr. Loadings ranged from 4–114 µg for Ni, 9–527 µg for Fe, 6–77 µg for Mn and 52–229 µg for Cr. Samples from four rounds of the proficiency programme, comprising 16 samples, were analysed. The average recoveries, standard deviations (SD) and relative standard deviations (RSD) are given in Table 2. Average recovery results for the WASP samples were 92–103% of the target value with RSD values of 3–7%. Given that these proficiency program samples are prepared with real welding fumes and not simply spiked filters, the results were found to be satisfactory.
The method was also assessed for repeatability and found to be less than 1% RSD based on measurements of the monitor sample.
Table 2. Recovery data for WASP proficiency samples.
Ni | Fe | Mn | Cr | |
Mean%(n) | 92.8 | 94.7 | 100.0 | 102.8 |
SD %(n) | 5.9 | 3.5 | 3.0 | 7.3 |
RSD (%) | 6.3 | 3.7 | 3.0 | 7.1 |
SD = Standard deviation
RSD(%) = Relative standard deviation
n = 16.
Standardless analysis
Modern X-ray spectrometers are stable, with minimal drift, provided major changes have not occurred such as new tube, flow counter window, damaged monitor specimen etc. Hence, analytical method calibration only needs to be performed once, with calibrations remaining valid for many months, if not years for some elements, provided monitor drift correction is performed and check samples run. However, the problem of preparing suitable calibration standards still exists with respect to welding fume analysis. This is because, for some chemicals, it may be difficult to make suitable calibration standards or the standard chemicals are not available. Commercial fundamental parameter or standardless software packages may provide a means of addressing this issue. Originally, these types of programs were viewed as semi-quantitative but can now be considered quantitative for some applications. They can be calibrated with stable thick intensity calibrator specimens such as metals and pressed powders, yet produce quantitative results of a satisfactory quality when welding fume samples are analysed.6 If standards are not available, they can also generate calibration constants by means of interpolation of intensity plots. This has the potential to eliminate the tedium of preparing dust or precipitate standards. Problems may exist with fundamental parameter methods, however, in that assumptions may need to be made about the oxidation state of the specimen analysed, whether to normalise results or not and assumptions made about the nature of the matrix when all elements cannot be determined. Nevertheless, these types of programs work well and, over the years, manufacturers have supplied new and improved products.
Conclusion
XRF spectrometry offers a convenient, accurate and reproducible method of analysing elements in welding fume collected from the breathing zone of workers who are occupationally exposed to this hazard.
References
- National Occupational Health and Safety Commission (NOHSC), Welding Fumes and Gases. Australian Government Publishing Service, Canberra, Australia (1990).
- Standards Australia, Health and Safety in Welding and Allied Processes—Sampling of Airborne Particles and Gases in the Operators Breathing Zone AS 3853.1-2006 Part 1: Sampling of Airborne Particles. Standards Australia, Sydney, Australia (2006).
- Health and Safety Executive (HSE), Methods for the Determination of Hazardous Substances: MDHS 91: Metals and Metalloids in Workplace Air by X-ray Fluorescence Spectrometry. HSE Books, Sudbury, UK (1998).
- Occupational Safety and Health Administration (OSHA), Sampling and Analytical Methods: ID-204: Quantitative X-ray Fluorescence Analysis of Workplace Substances. OSHA Technical Center, Salt Lake City, USA (2002).
- National Health and Medical Research Council (NH&MRC), Methods for Measurement of Quartz in Respirable Airborne Dust by Infrared Spectroscopy and X-Ray Diffractometry. Australian Government Publishing Service, Canberra, Australia (1986).
- J.A. Hurst, J.A. Volpato and G.E. O’Donnell, “The determination of elements in welding fume by X-ray spectrometry and UniQuant”, X-Ray Spectrom. 40, 61 (2011). doi: 10.1002/xrs.1295