Shuo He Yan,a,* Zheng Zhua and Joëlle Wallonb
aFaculty of Bioscience Engineering, Université Catholique de Louvain, Rue de la Neuville 54/101,1348 Louvain-la-Neuve, Belgium. E-mail: [email protected]
bAnatomie Pathologique, A.N.A.P., Avenue de la Corniche 10, 1310 La Hulpe, Belgium
Introduction
Near infrared (NIR) spectroscopy diagnosis of human breast cancer uses tissue sections similar to those used by pathologists. However, in NIR analysis, both non-stained cancerous and non-cancerous tissue can be assessed. Moreover, NIR diagnosis is dependent upon comparison with normal tissue, which is chosen from a benign fibroglandular non-tumorous zone. Our approach is to try to determine the difference between the two tissue types, and express as frequency (F %) those points in NIR second-derivative spectra that only exist in normal tissue (points of difference).
We have identified four zones within the NIR wavelength region with differences between cancerous and non-cancerous tissue: zones A (1160–1260 nm), B (1740–2070 nm), C (1990–2070 nm) and D (2310–2380 nm): Figure 1(c). Within zone C, there are two points of difference, C1 (2012–2016 nm) and C2 (2044–2048 nm), which are always found in normal (non-cancerous) tissues, so their F % is as high as 100 %. Conversely, in cancerous tissue, it is as low as nearly 0 %. This difference may originate from either ATP or DNA, since ATP has a C1 at 2016 nm and a C2 at 2048 nm in normal tissues, but DNA has a C1 at 2034 nm and a C2 at 2078 nm in cancerous tissues. Hence why NIR spectroscopy can diagnose tissue types as cancerous or not in human breast tissue qualitatively.1
The points of difference in zone B include B2 (1764–1768 nm) and B3 (1786–1788 nm), where F % is always as high as 100 % in normal (non-cancerous) tissues. However, in cancerous tissues, F % starts at a level of 90–100 % in SBR I tissue and then decreases rapidly from 70 % to 30% in SBR II sub-type tissue from IIa to IIc, and reaches 0 % in SBR III cancerous tissues. The Scarff-Bloom-Richardson (SBR) system grades tumours into three prognostic categories and is used to discriminate the aggressiveness of invasive ductal carcinomas.
This system is applied only to discriminate the aggressiveness of invasive carcinomas. This difference may come from the breast lipids, which are seen in B2 at 1766 nm and B3 at 1788 nm in normal breast tissues. So, breast lipids may enable NIR spectroscopy to diagnose cancerous aggressiveness quantitatively.1,2
Our first paper on this topic was published in Applied Spectroscopy in 19943 and the results were also reported at the 6th International Conference on NIR Spectroscopy (ICNIRS). At the 7th ICNIRS in 1995,1,2 we reported qualitative and quantitative NIR diagnosis of tissue types and cancerous aggressiveness using F % for a single case or mean frequency MF % for each type.
At the 10th International Breast Disease Congress in 1998,4 we introduced chemometric techniques combined with F % to characterise cancerous and normal human breast tissues. The difference in F % between the two tissues types expressed by the t-value in zones B and C is 4.59–4.75 and 7.86–8.02, respectively; the p-values are less than 0.01 and 0.001, respectively, confirming the significance of the results. Moreover, principal component analysis (PCA) can be combined with NIR F % in the calibration, prediction and test sets for qualitative and quantitative analysis. At that meeting, many pathologists were surprised to see that microscopy diagnosis could be replaced by NIR spectroscopy with a 95 % precision.
To understand the basis of the NIR diagnosis, we have pioneered 14C-glucose metabolism research since 1994. In cancerous tissues, glucose escapes the normal metabolic pathway and follows the pentose phosphate pathway, which is why the F % is 0 % in zone C. We have also confirmed that the F % is always as high as 90–100 % in non-cancerous tissues. Through this process we find that the lipid content decreases as the cancerous aggressiveness increases. The NIR diagnosis of aggressiveness only results from breast lipids, neither ATP nor DNA are involved here. Moreover, we also established the NIR qualitative diagnosis of MCF7/6 breast cancer cells based on cytological evidence.
The purpose of writing this article is to thank Professor John M. Chalmers, who invited me to write a review paper on beer for the Handbook of Vibrational Spectroscopy. This invitation gave me the courage to write a book in English on breast cancerous research, which John edited.1 NIR spectroscopy is a truly captivating field and I was delighted to serve on the organising committees of the 3rd and 4th ICNIRS.
In the process of writing the Chinese version of our English book,1 which re-analysed the results of past studies, I realised that the results of the glucose metabolism study might lead us to understand the basis for an early diagnosis based solely on body temperature, which would avoid any surgical intervention in diagnosis. This will have to be confirmed by my successors, and I wish them success.
Results and discussions
Differences between cancerous and normal tissues exist in their NIR spectra
Supposing that there are differences in the spectra of cancerous and non-cancerous tissues, it is reasonable to assume that these should be easier to distinguish in spectra recorded from more aggressive cases, such as an invasive ductal carcinoma (IDC), grade SBR III.3
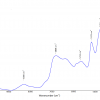
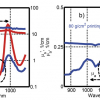
Non-cancerous and normal tissue samples were collected at a distance from the cancerous zone, and cancerous tissue samples were taken from the non-necrotic cancerous zone. The original mean spectra were collected from ten corresponding tissue sections using the NIR log10 (1/R) values, and were recorded from both cancerous (C) and non-cancerous (N) tissues. The spectra of these two types are shown in Figure 1(a). The overlaid second-derivative NIR spectra of N and C tissues from the same SBR III grade case are also shown in Figure 1(b).3
After a comparison of the two overlaid second-derivative spectral profiles from 1100 nm to 2500 nm, we were able to select four zones of bands, A, B, C and D [Figure 1(c)]. To evaluate whether a significant difference existed between the means of the two types of breast tissue, we used the points of difference in nm as the statistical input data from 52 cases (including one MCF7/6 cultured cancerous cell) and 337 tissue sections. After a t-test5 for zones C (1950–2122 nm) and B (1730–1822 nm), the highest t-values were 7.86–8.02 and 4.59–4.75, so the p-values are less than 0.001 and 0.01. Therefore, we proposed that the difference between C1, C2 and B2, B3 points of difference could be used as an NIR spectroscopy diagnostic tool, and we called them diagnostic map C and diagnostic table B, respectively.1
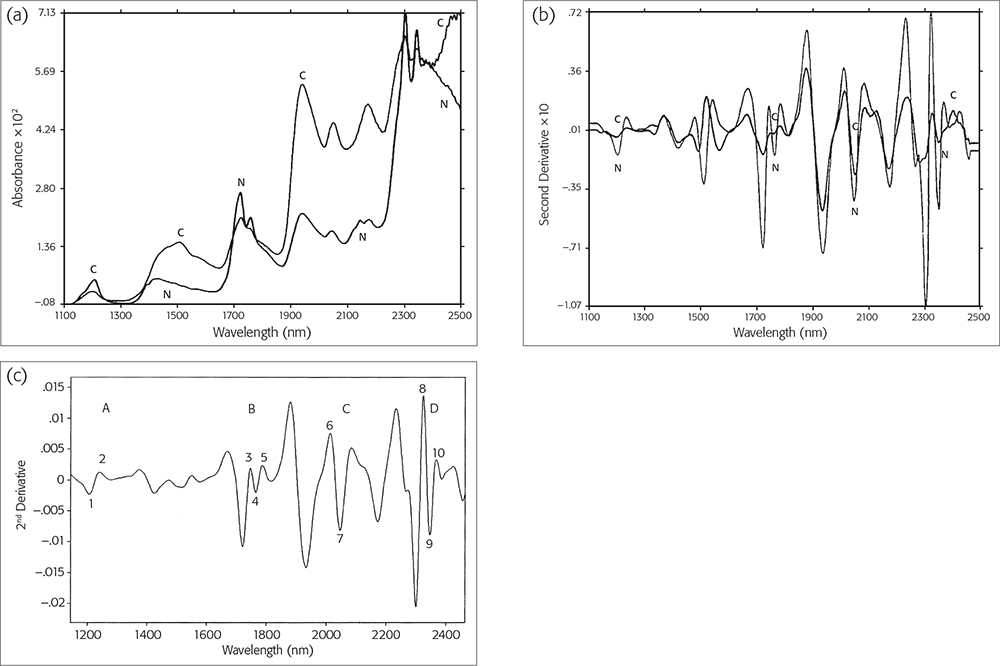
Figure 1. (a) NIR original spectra and (b) NIR second-derivative spectra of cancerous (C) or normal (N) tissues. Reproduced from J. Wallon, S.H. Yan, J. Tong, M. Meurens and J. Haot, “Identification of breast carcinomatous tissue by near-infrared reflectance spectroscopy”, Appl. Spectrosc. 48(2), 190–193 (1994). (c) Second-derivative spectra from a control normal sample showing the four selected zones and the points of difference within them. Reproduced from J. Wallon, S.H. Yan and J. Haot, “identification of human breast tissue by NIR spectroscopy”, in Near Infrared Spectroscopy: The Future Waves - Proceedings of the 7th International Conference, Ed by A.M.C. Davies and P.C. Williams. NIR Publications, Chichester, UK. https://store.impopen.com/near-infrared-spectroscopy-the-future-waves-p…
Evaluation of NIR diagnosis by calibration, prediction and test set
The results of the calibration and prediction series, each from 52 individual cases, are shown in the scores plots in Figure 2(a and b). Hence, we had 28 and 24 mean spectral data values from each series with points of difference of cancerous and non-cancerous cases, respectively.1
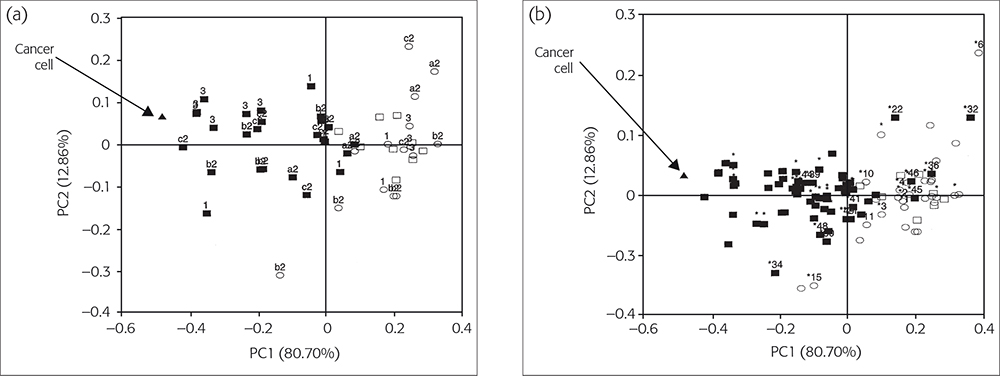
Figure 2(a). The PC1 vs PC2 diagnostic map C for classifying SBR-grade cases. (b) Improvement of Figure 2(a) by using NLM-PCA. © 2009 IM Publications, reproduced from Reference 1 with permission.
Calibration set
The calibration set consisted of 27 (IDC) SBR grade I, II and III patients (black squares) and one MCF7/6 cancerous cell (black triangle), and 15 SBR grade non-cancerous tissue (open squares) and 9 benign tumour patients with normal tissues (open circles), Figure 2a. Figure 2(a) shows the best PCA map C, obtained using pre-processing with range-scaling, in which the first two PCs together accounted for 93.56 % of the original variances: PC1 for 80.70 % and PC2 for 12.86 %.
In Figure 2(a), all 27 (IDC) cases are closest to the MCF7/6 cancerous cell, followed by the aggressive cases from SBR III (3), IIc (c2), IIb (b2) and SBR I (1) patients. All normal control and non-cancerous cases lie furthest away from the MCF7/6 cancerous cell position. The incorrectly or borderline classified cases correspond to 2 % (1/52) and 6 % (3/52) for non-cancerous and cancerous cases, respectively. However, if the same input data were treated by non-linear regression first and then plotted with PCA, the mapping error decreased from 0.012060 to 0.006142. Then it would be easy to determine whether both cases were just borderline or not.1
Prediction set
Figure 2(b) shows results for the prediction set. It has been overlaid on Figure 2(a) to validate the calibration. We have developed a software package—CAIBT (Chemometric Approaches to Identify Human Breast Tissues, not published)—to automate the testing of individual cases. The NIR spectral data are input and the case type is determined by its position compared to the calibration samples;6 the closer, the higher is the resemblance. In conclusion, the NLM-PCA map can diagnose higher or lower-grade aggressive SBR cases with an acceptable error rate.1,7
Test set
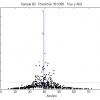
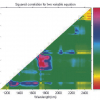
The test set was used to validate the NIR procedure:1 for example, the ability of the procedure to distinguish malignant from benign breast cases, and the most malignant aggressive cases from the lesser ones. Input data included 35 cases of fibroadenoma and control, non-malignant, surrounding tissues. In total, 92 cases are shown in Figure 3, which shows map C for the best PCA diagnosis.1 All input data was pre-processed by range scaling, combined with mean centring. Furthermore, 96.22 % of the original variances are accounted for, PC1 for 84.37 % and PC2 for 11.85 %.
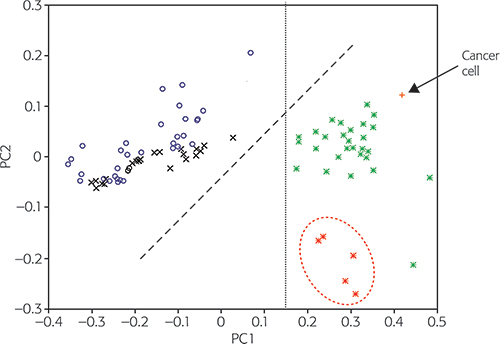
Figure 3. The PC1 vs PC2 diagnostic map C to classify breast tumour types. FG: fibroglandular (normal); FA: fibroadenoma (benign); MA: non-malignant; Control MA: control non-malignant surrounding tissues; Cancer: MCF7/6 cancer cell. © 2009 IM Publications, reproduced from Reference 1 with permission.
The 33 malignant tumour score points (*) from aggressive higher-cystosarcoma phyllodes (hCP) malignant tumour cases are clearly located on the right of the map along with the MCF7/6 cancerous cell score (+) point. The five less-aggressive lower-cystosarcoma phyllodes (lCP) malignant tumour cases (*) are located towards the bottom of the right half; a dashed ellipse has been drawn around these. The score points from control normal or non-malignant (o) and benign (x) tissues are positioned separately, mostly in the left part of map C. Normal and non-cancerous (o) samples have a tendency to lie closer to the top of map C, while benign tumour score (x) points are more often located nearer to the middle of Figure 3. The boundary line through PC1 = 0.15 (from the bottom to the top) clearly separates the MCF7/6 cancerous cells and all malignant tumour score points in the right part of Figure 3, with all other types of tissue being situated in the left part.
NIR diagnostic tools in zone C and B are based on ATP or breast lipids
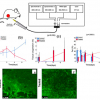
NIR diagnostic tools in zone C are based on ATP, in which normal tissues have C1 at 2016 nm and C2 at 2048 nm. ATP spectra were recorded using the following procedure: about 10 mg ATP chemical reagent (Roche Biochemical, Inc., purity 100 %) was sandwiched between two glass coverslips, then placed between two 50-mm diameter glass-fibre filters (Millipore AP 4007), each having a 20 mm diameter hole in the centre and mounted between two 55-mm diameter glass windows. The assembly was then placed in the reflectance sample cup. The spectra of ATP were measured from 1100 nm to 2500 nm at wavelength intervals of 2 nm. A background reference spectrum was obtained by recording the NIR spectrum under the same conditions as the sampling assembly, but without ATP being present. The ATP original spectrum was transformed into the second derivative NIR spectrum by NSAS software (Foss). The NIR spectra of DNA (also RNA) were recorded in the same procedure as for ATP.1,8
The spectra of MCF7/6 cells were recorded by the following procedure: MCF7/6 cells were first washed with physiological water and then centrifuged for 10 min at 5000 rpm and 10 °C. Then washed again using distilled water and centrifuged again under the same conditions. A suspension drop containing about 1–2 mg of fresh cells, after drying at room temperature to form a thin uniform film, was placed between a pair of cover slips, then sandwiched together and placed in the reflectance sample cup. NIR reflectance spectra of MCF7/6 cells were recorded for ATP and DNA.1,8
NIR diagnostic tools in zone B are based on breast lipids, with B2 found at 1766 nm and B3 at 1788 nm in normal tissues. That is why zone B can diagnose cancer aggressiveness quantitatively by using F % or MF %.2,9 The breast lipid spectra were recorded as follows. A cancerous tissue section with SBR I grade was maintained at about 95 °C to 100 °C for five minutes, after which a drop of breast lipids was revealed in the form of an oil drop that was yellow in colour. This was then collected using a glass Pasteur pipette (230 mm, VWR International SAS) and placed between a pair of cover slips for NIR analysis. The NIR second-derivative spectra of these breast lipids are within the range of the B2 and B3 significant points of difference of normal human breast tissues, as collected from the non-tumour zone of benign fibro-glandular tumours (see Table 1).
Table 1. Comparing the NIR diagnostic tool with test-points of breast lipids, ATP or DNA.
| Test points
| Normal tissue (nm) | Non-cancer tissue (nm) | Breast lipids (nm) | ATP (nm) | Cancerous tissue (nm) | MCF7/6 cancer cells (nm) | DNA (nm) |
C1 | 2012–2016 | 2012–2016 | — | 2016 | 2018–2022 | 2024 | 2034 |
C2 | 2044–2048 | 2044–2048 | — | 2048 | 2052–2058 | 2058 | 2078 |
B2 | 1764–1768 | 1764–1768 | 1766 | 1774 | 1750–1762 | 1730 | 1752 |
B3 | 1786–1788 | 1786–1788 | 1788 | 1798 | 1770–1784 | 1782 | 1776 |
Table 1 is a summary of the elementary reasons why NIR spectroscopy delivers diagnostic evidence as well as the motivation for all our research.5 In the corresponding NIR spectra, there are two peak positions for DNA in zone C at 2034 nm and 2078 nm, but for MCF7/6 breast cancer cells it is at 2024 nm and 2058 nm. Both are shifted and far away from ATP or non-cancerous tissues. Therefore, we can identify cancerous cases from non-cancerous cases using the NIR diagnostic tool of C1 and C2.
ATP can also be a valuable tool for the diagnosis of breast cancer: in cancerous tissue, ATP is absent, but DNA exists, so the F % in zone C is always 0 %. However, the F % in zone B is as high as 90–100 % in SBR I cancerous tissue, decreases rapidly from 70 % to 30 % in SBR II and to 10-0 % in SBR III cancerous tissue.1 This means that breast lipids are a valuable tool for the diagnosis of breast cancer aggressiveness.1
The NIR spectra of fresh MCF7/6 cells are similar to cancerous tissues, but are completely different from those of normal or non-cancerous tissues.5
Evaluation of NIR tools based on 14CO2 production ratios Vn and Vc5,6
In 1998, we discovered that glucose metabolism changes when human breast cancer develops. In order to elucidate the complex metabolic pathways of glucose, it is often necessary to use selective-positioning of the radioisotopic label. For example, 1-14C-glucose (in which the first carbon is labelled), 6-14C-glucose (in which the sixth carbon is labelled) or U-14C-glucose (which is uniformly labelled; all carbons from positions one to six are labelled).
If 14C-glucose follows a different metabolic pathway in cancerous and non-cancerous tissues, this will be reflected in the 14CO2 production ratios, Vc or Vn, respectively. If (Vn-1/Vn-6) = 1, it will have followed the Embden–Meyerhof process and the Krebs cycle pathway, and tissue is normal or non-cancerous. If (Vc-1/Vc-6) > 1, it will have followed the pentose phosphate pathway and is cancerous tissue.
Of the seven patients (aged from 41 to 60), one had a fibro-glandular benign tumour and two each had SBR I, SBR II and SBR III grade tumours. We wanted to determine the relationship between F % and the 14CO2 production ratios (Vc or Vn).10
Table 2 shows the F % analyses of 10–15 tissue sections of both cancerous and non-cancerous tissue. The MF % data (in brackets in Table 2) are given for reference. These were collected from six benign tumours and IDC SBR I, II and III cases. In total, 27 cases of normal or non-cancerous tissues. The MF % data were collected from 35 different types of tumour cases, and from SBR I, II and III IDC cases; in total 34 cases10 of cancerous tissues are listed in Table 2.
Table 2. Relationship between F % (MF %)2 and 14CO2 ratios of Vn or Vc in SBR tissues.
Pathological cases types: N or C | F % or (MF %) in zone B or C | 14C-glucose ratio between Vc and Vn for: | |||||
| C (cancerous) | N (normal) | U-14Cglu. | 1-14Cglu. | 6-14Cglu. | ||
| C | B | C | B | Vn-U, Vc-U | Vn-1, Vc-1 | Vn-6, Vc-6 |
Normal tissue: | F % (MF %) | Vn = 0.901 and 0.862, mean 0.882 | |||||
| 0 (85) | 80 (85) | 100 (100) | 100 (100) | Vn-U & Vc-U | Vn-1 & Vc-1 | Vn-6 & Vc-6 |
Vn or Vc from: | |||||||
SBR I-a | 0 (0) | 80 (86) | 90 (100) | 90 (100) | 1.323 & 2.800 | 0.919 & 1.992 | 0.911 & 1.341 |
SBR I-c | 0 (4) | 70 (81) | 90 (88) | 90 (97) | 2.155 & 3.135 | 1.421 & 2.817 | 1.462 & 1.899 |
SBR II | 0 (2) | 70 (60) | 80 (84) | 90 (94) | 0.836 & 2.389 | 0.513 & 3.092 | 0.505 & 1.330 |
SBR II-c | 0 (0) | 30 (20) | 80 (78) | 90 (72) | 0.784 & 2.547 | — & 4.092 | — & 1.412 |
SBR III | 0 (0) | 10 (8) | 70 (66) | 80 (78) | 0.402 & 1.840 | 0.107 & 4.825 | 0.089 & 0.793 |
SBR III | 0 (0) | 0 (0) | 60 (56) | 70 (68) | 0.218 & 2.263 | — & 7.042 | — & 0.723 |
The 14CO2 production ratios (Vc or Vn) for the same seven patients5,6 were collected with the following procedure. For each type of tissue, about 200 mg (±10 mg) was used, which was obtained from breast resections and then immersed in physiological water at about 10 °C. The specimen was first removed from the fat and dried with Whatman 2 filter paper. The enzymatic activity of the tissue remained constant over about 36–40 h. The tissue sample was then washed with physiological water and distilled water before analysis. Variously labelled forms of 14C-glucose (2 µCi) from Service des Molécules Marquées, France, were added separately to each sample for a final glucose concentration of 0.5 µmol. The resulting suspensions were incubated at 37 °C for 2 h under atmospheric conditions. The 14CO2 production was measured as V = nanomole min–1 g–1 of fresh tissue.
Comparing the results from Table 2, the Vn-1/Vn-6 data ratios range from 0.97 (1.421/1.462) to 1.01 (0.513/0.505) and 1.20 (0.107/0.089) for SBR I, II and III non-cancerous tissue, but 1.48–1.49, 2.33–2.90 and 6.09–9.74 for SBR I, II and III cancerous tissues. These results clearly confirm that F % is 0 % due to DNA replacing ATP in zone C. However, F % is 90–100 % in SBR I, decreasing from 70 % to 30 % for SBR IIa to IIc and reaching 0 % for SBR III cancerous tissue in zone B. These results clearly confirm that the F % of zone B decreases as cancer aggressiveness increases, and that this is due to changes in breast lipids. Moreover, the F % data of SBR I cancerous tissues are 0 % in zone C, and the 1-14CO2/6-14CO2 ratios of the same tissues are higher at 1.5, so the two methods confirm that SBR I is cancerous. However, in zone B, the F % of SBR I cancerous tissues is still over 90 % , for SBR II it becomes 70-30 % and for SBR III 0 %. This shows that lipid metabolism changes after changes in glusose metabolism changes.
14C-glucose Vn data may allow early diagnosis by NIR7
Using standardisation of 14C-glucose Vn data, it looks possible to develop a method based on NIR spectroscopy to diagnose breast cancer in its early stages. Standardisation is a common statistical tool and widely exploited in difference series data values. In our case, first, we define the normal breast tissue Vn data as 100 and establish it as a comparable standard. Then all non-cancerous tissue input data are standardised. For example, using the three types of 14C-glucose,8 normal tissue input Vn data are 0.882, 0.538 and 0.560 in Table 3, after standardisation they all become 100. However, for the same three types of 14C-glucose for SBR I non-cancerous tissue, the input data are 1.323, 0.919 and 0.911. After standardisation they become (1.323/0.882) × 100 = 150, (0.919/0.538) × 100 = 171 or (0.911/0.560) × 100 = 163 and so on, as shown in Table 3.
Table 3. Standardised 14CO2 production Vn data in non-cancerous tissues.
Tissue type | U-14C-glucose | 1-14C-glucose | 6-14C-glucose | |||
Normal tissue (Vn) | 0.882 | as (100) | 0.538 | as (100) | 0.560 | as (100) |
SBR I (Non-cancerous) | 1.323; 2.155 | (150; 244) | 0.919; 1.421 | (171; 264) | 0.911; 1.462 | (163; 261) |
SBR II (Non-cancerous) | 0.836; 0.784 | (95; 89) | 0.513 | (95) | 0.505 | (90) |
SBR III (Non-cancerous) | 0.402; 0.218 | (46; 25) | 0.107 | (20) | 0.089 | (16) |
as: after standardisation
The 14CO2 production Vn data are shown in the left-hand of the pairs of columns for each of the three types of 14C-glucose in Table 3 and on the right after standardisation: 150 and 244, 171 and 264, 163 and 261 from the U-14CO2 and 1-14CO2 and 6-14CO2, respectively, for two cases of SBR I non-cancerous tissues. However, the corresponding non-cancerous tissue data for SBR II are 95 and 89 for U-14CO2, and only 95 or 90 for 1-14CO2 or 6-14CO2 non-cancerous tissues. The 14CO2 ratios decreased rapidly in SBR III cases, only 46 and 25 from U-14CO2, and 20 and 16 from 1-14CO2 or 6-14CO2. So, the Vn data for SBR I (244–264) are about 3–16 times higher than same normal tissue (100) or non-cancerous tissue of SBR II (89–95) or SBR III (46–16). This result reports an important piece of information, which suggests that 14C-glucose catabolism in non-cancerous SBR I cases will be quantitatively higher than normal and lower than non-cancerous SBR II or SBR III. Breast cancer development times from SBR I to SBR II are a minimum of three months, ignoring any influence from chronic diseases. If after this period the body temperature suddenly drops, this may suggest that SBR I has progressed to SBR II or SBR III, which may help in the development of a method to use NIR spectroscopy to provide early diagnosis by monitoring body temperature.
Why did we not recognise this important information before? First, we only used normal tissue as a standard to establish a diagnostic tool. Second, we accepted the point of view of our pathologist, who never paid attention to normal tissue.7 Thanks to standardisation, we have made this discovery and will hopefully be able to develop NIR-based, early diagnosis tools.
Conclusions
This article introduces NIR spectroscopy as an efficient method to compare 14C-glucose metabolism and pathological diagnosis. However, as we have presented elsewhere,8 only NIR spectroscopy can evaluate the metabolism of lipids and glucose from a quantitative and qualitative point of view. Moreover, NIR spectroscopy is accurate, fast, cheap and easy to commercialise. We believe that they all have an excellent future. We believe that skin cancer and pigmented cancer could easily benefit from this method, because it is easy to find normal tissue for modelling, and there is no for need research samples to be obtained through surgery. In this way, we could develop an early temperature test to discover SBR I breast cancer.
References
- S.H. Yan and J. Wallon, Identification of Human Breast Cancer by NIR Spectroscopy and Radiorespirometry, Ed by John M. Chalmers. IM Publications, Chichester, UK (2009). https://store.impopen.com/near-infrared-spectroscopy-the-future-waves-proceedings-of-the-7th-international-conference.html
- J. Wallon, S.H. Yan and J. Haot, “Identification of human breast tissue by NIR spectroscopy”, in Near Infrared Spectroscopy: The Future Waves, Ed by A.M.C. Davies and Phil Williams. NIR Publications, UK, pp. 337–342 (1996). https://www.impopen.com/book-summary/978-1-906715-20-5_ch59
- J. Wallon, S.H. Yan, J. Tong, M. Meurens and J. Haot, “Identification of breast carcinomatous tissue by near-infrared reflectance spectroscopy”, Appl. Spectrosc. 48(2), 190–193 (1994). https://doi.org/10.1366/0003702944028542
- J. Wallon, S.H. Yan, J. Mayaudon and J. Haot, “Characterization of carcinomatous and normal human breast tissues by near infrared spectroscopy (NIRS) combined with chemometric techniques”, Proceedings of the 10th Int. Cong. on Senology Breast Diseases, Oporto, Portugal, May 31 to June 4, 1998, Ed by J. Cardoso da Silva. Monduzzi Editore Pub., Italy, pp. 691–694 (1998).
- J. Mayaudon, S.H. Yan and J. Wallon, “A proposed estimate of the tumor aggressiveness of human breast cancer using radiorespirometry,” IUBMB Life 45(6), 1073–1079 (1998). https://doi.org/10.1080/15216549800203292
- S.H. Yan, J. Wallon and J. Mayaudon, “Rate of 14CO2 production from variously labeled forms of 14C-glucose in human breast invasive ductal carcinoma tissues”, IUBMB Life 48(4), 409–411 (1999). https://doi.org/10.1080/713803528
- S.H. Yan, J. Mayaudon and J. Wallon, “Identification of the Lower Cancerous Aggressiveness as SBR in Human Breast Tissues by using Radiorespirometry”, The Breast Journal 4(Supplement 1), 403–S64 (1998).
- J. Wallon, S.H. Yan, M. Meurens and J. Haot, “Spectroscopie proche infrarouge de tissus mammaires normaux et carcinomateux et correlation avec l’anatomie pathologique”, in 4ème Journée Francophone de Cytologie Clinique, Bruxelles, Belgium [in French] (1992).
- S.H. Yan, J. Mayaudon and J. Wallon, “NIR prediction and biochemical properties in human breast invasive carcinoma tissues”, J. Near Infrared Spectrosc. 6(A), 273–277 (1998). https://doi.org/10.1255/jnirs.207
- S.H. Yan and J. Wallon, “Estimate of human breast invasive ductal carcinoma aggressiveness by 14CO2 production from variously labeled forms of 14C-glucose”, Proceedings of the 6th National and International Breast Cancer Congress, September 7–9, 2000, Tianjin, China, pp. 8 (2000).