Dmitry Khoptyar, Sören Johansson, Staffan Strömblad and Stefan Andersson-Engels
Department of Physics, Lund University, PO Box 118, SE-221 00 Lund, Sweden. E-mail: [email protected], [email protected]
Introduction
Broadband photon time-of-flight (PToF) spectroscopy is a rapidly developing spectroscopic tool for advanced analysis of a range of scattering samples in biomedical, industrial and environmental applications. The technique is capable of simplifying and improving the robustness of the spectroscopic analysis by independently evaluating both the absorption and scattering properties. Using illustrative examples of original experimental data we discuss in this article the principles and implementation of broadband PToF spectroscopy. We illustrate the unique capabilities of this novel technique by presenting broadband absorption and scattering spectra of representative food and paper samples.
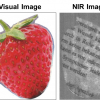
Light scattering is one of the most common optical effects we encounter in everyday life. Light scattering is responsible for a majority of the atmospheric optical phenomena that make our world look as we know it. The blue colour of the sky during the day time and the reddish colour at sundown are results of so-called Rayleigh light scattering in the atmosphere, whereas the white colour of clouds is the result of Mie scattering. Light scattering is also responsible for the appearance and the light propagation conditions in a broad variety of objects around us. Light scattering is responsible for the white colour of typical foods (e.g., dairy products, sugar, fruits, eggs, flour and many more), painted surfaces, paper, plastics, bright cloth etc. Furthermore, it is mainly light scattering that determines our own appearance. Very high scattering of the surface layer of skin makes Caucasians look white, whereas the selective reflection of short light wavelength by retina, which also happens as a consequence of scattering, results in blue eye colour. Importantly, light scattering also strongly affects how light is propagated in biological tissues and the human body.
From this it not surprising that diffused optical spectroscopy (DOS), the branch of optical spectroscopy dedicated to the study of samples in which the light propagation is affected by both absorption and scattering, is extremely important in modern science and technology. The characteristic examples of typical DOS sample applications are: (live) biological tissue, pharmaceuticals, diverse foodstuffs and chemical products, cosmetics, plastics, and various environmental samples. In recent decades DOS has become an increasingly important tool in such important areas as medicine, the production industry and environmental monitoring.
In industrial applications the optical spectroscopy method provides the means for relatively simple, fast, non-destructive, in situ, flexible and precise analysis which typically does not require sample preparation. It can be implemented on-line, in-line and at-line, and importantly is typically lower cost than alternative techniques.
In the biomedical applications light spectroscopy offers an opportunity for non-invasive and thus pain- and infection-free means for monitoring key physiological parameters (for example, oxygenation) for diagnostics and treatment monitoring of severe and widespread diseases such as cancer. It is known, for example, that enhanced metabolism of cancer results in excessive vascularisation and low oxygenation in the malignant tumours. This affects absorption and scattering properties of tissue and may be used as intrinsic cancer biomarkers.
As mentioned above, the high sensitivity and versatility of DOS spectroscopy as an analytical technique comes from its ability to monitor both light absorption and scattering. The light absorption occurs due to light interaction with atoms and molecules. The absorption thus provides information about the chemical composition of the sample. The scattering typically occurs due to tiny random irregularities in sample structure causing fluctuations of the refractive index. The scattering therefore provides information about the micro- and nanostructure of the sample, its physical conditions and the other physical properties. Both the absorption and the scattering information are thus complementary and very important for evaluating the sample properties relevant for the particular application needs.
Although very useful and highly important, DOS can be challenging and complicated. The light propagation in turbid samples is simultaneously affected by both absorption and scattering. Unfortunately these effects may in practice not be easily differentiated and separated from each other. The main challenge is that the path-length the light travels in the sample is dependent on sample properties and is unknown. In other words, the Beer–Lambert law that is widely employed for analysis in conventional optical absorption spectroscopy cannot be easily exploited in the analysis of turbid sample as there is no defined light path.
The data analysis in diffuse optical spectroscopy is typically based on data pre-treatment and chemometric techniques. These methods are based on an analysis of a representative library of optical spectra from multiple samples with different optical properties. Then, an advanced mathematical routine is used to classify and characterise each new sample by its similarity to those earlier measured samples. Although this is often a very effective approach, it also has essential shortcomings. First, it requires design and maintenance of elaborate sample libraries, which is costly and time/labour consuming. Second, it may not be possible to ensure that the sample library is complete, and there is a probability of encountering a sample with unusual properties that cannot be analysed and classified. This would cause breakdown of the analysis. Third, the design of a classification library (e.g., a chemometric calibration model) may not even be feasible in some cases. This, for example, may be the case in, e.g., biomedical applications as all the patients are naturally unique. Fourth, empirical chemometric analysis does not directly give insight into understanding underlying sample physical properties, which is indeed a limitation for a number of applications.
In response to the apparent challenges in DOS in recent years, there has been a strong interest towards the development of advanced spectroscopic techniques that enable differentiation and discrimination between absorption and scattering effects directly during the measurements. Such techniques can strongly facilitate analysis and interpretation of spectroscopic data. Indeed, decoupling of absorption and scattering allows for reducing the size and complexity of calibration databases, which leads to more robust and simple analysis. Furthermore, in contrast to chemometric pseudo-variables, the absorption and scattering are well-defined physical quantities that facilitate interpretation of the experiment and understanding of physical and chemical properties of the sample.
A major advance in one of those techniques—PToF spectroscopy—has been made in recent years.1,2,3,4 The Biophotonics Group at Lund University in Sweden has recently developed a broadband spectrometer for evaluation of absorption and scattering spectra of very diverse turbid materials in the visible and close-near infrared (NIR) regions.2,5
Photon time of flight spectroscopy
The basic principles of PToF are as follows. A short (~30 ps) optical pulse is used to probe the optical properties of the turbid sample to be investigated. This is possible since the shape of the pulse is evolving during the propagation within the sample due to the cumulative effects of absorption and scattering. By fitting an appropriate model for turbid light propagation to the shape of the detected pulse it is possible to evaluate the absorption and reduced scattering coefficients in the sample. The absorption (ma)coefficient gives here the absorption probability per unit path-length, whereas the reduced scattering (ms) coefficient accounts for a number of effective isotropic scattering events per unit path-length.
A simplified scheme of the PToF spectrometer is depicted in Figure 1.

A photonics crystal fibre (PCF) supercontinuum source (SCS) is used to generate broadband optical pulses in the spectral range from approximately 450 nm up to 1800 nm and above. The typical SCS for PTOF spectroscopy has a 40 MHz or 80 MHz repetition rate and a total optical power from a few W up to 10 W. An electronically tuneable Acousto Optical Tuneable Filter (AOTF) is used to spectrally filter narrow probe pulses from the broadband supercontinuum. Normally three relatively narrowband AOTFs are needed to fully cover the spectral range of the SCS. The probe pulses are guided to the sample via graded-index optical fibres. Graded-index fibres are used in order to avoid pulse broadening due to multimodal dispersion. After propagation in the sample the pulses are collected by another piece of the same type of fibre and routed to the single photon counting (SPC) detector monitored by time correlated single photon counting (TCSPC) electronics. A fibre optics attenuator is used to appropriately adjust for TCSPC signal level. The setup is controlled by a personal computer.
The SCS sources suitable for PToF spectroscopy are currently provided by Fianium Ltd, Southampton, UK, and NKT Photonics A/S, Birkerod, Denmark. These companies also provide a wide selection of AOTFs. In the setup developed by the Lund University Biophotonics group we utilise a SPC-130 TCSPC (card Becker & Hickl, Berlin, Germany), as well as a SPC avalanche photodiode (PD1CTC Micro Photon Devices, Bolzano, Italy) and an NIR-extended micro-channel plate (MCP) photomultiplier tube (PMT) (R3809U-68 Hamamatsu Photonics, Hamamatsu, Japan) as SPC detectors.
Dependent on the investigated sample the PToF measurements can either be performed with fibres immersed in the sample (e.g., a liquid), positioned on the surface of solid sample (see Figure 1) or in the transmission mode, i.e. on opposite sides of the sample (e.g., on both sides of a tablet). In either case an appropriate model for turbid light propagation has to be utilised2,6 in order to evaluate the absorption and reduced scattering coefficients.
Experimental data examples
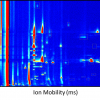
Typical experimental PToF distributions are shown in Figure 2.
. Experimental data fits are plotted as black lines.")
The curves are instructive for observing the absorption and scattering effects on the shape of the probe pulse propagated in the sample. In this figure, the original probe pulse at 980 nm (IRF, red) is plotted together with three detected pulses at 700 nm, 830 nm and 980 nm after a 15 mm propagation under different conditions through 1.5% fat content milk. The scattering results in probe pulse broadening as the pulse photons take individual optical paths through the sample. A stronger scattering results in a wider pulse broadening compared to the weaker scattering (cf. green and blue line). The absorption acts predominately on the delayed photons with long path-length and therefore it results in pulse narrowing. The absorption effect is seen by comparing the blue and magenta curves in Figure 2 corresponding to strong and weak absorption, respectively. Although the probe pulse shape and position are changed slightly depending on the wavelength, this effect is marginal compared to the influences of absorption and scattering; probe pulses at 700 nm and 830 nm have been omitted in Figure 2 to simplify the picture. The fit of the experimental data with the model for light propagation in turbid media (black lines in Figure 2) enables one to evaluate absorption and scattering at the probe pulse wavelength.
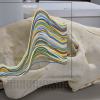
Characteristic examples of the absorption and reduced scattering coefficients spectra obtained by spectral scanning of the probe pulses are depicted in Figure 3. The absorption and reduced scattering coefficients spectra of 1.5 % fat-content milk and Edamer cheese are plotted in Figure 3a as red and blue lines, respectively. The data is taken at 15 mm and 10 mm fibre separation for milk and cheese, respectively. In the visible spectral range, the relatively high absorption of cheese at short wavelength is clearly consistent with the typical yellow Edamer colour. In the NIR range, the higher water content in milk results in a stronger 980 nm absorption peak, whereas much higher fat contents in cheese (23% vs 1.5% in milk) makes the cheese absorption peak broader than that of milk. The scattering for the both samples is similar but has slightly different dependencies on the wavelength. This reflects apparent structural difference between the samples. This information can be utilised for process monitoring and quality control in the dairy industry.
 1.5% fat content milk (red) and Edamer cheese (blue); b) printing paper.")
In Figure 3b the absorption and scattering coefficient of 80 g m–2 printing paper are plotted as a function of the wavelength. The measurements were performed on a stack of 15 sheets in transmission geometry. The strong light scattering in paper observed in Figure 3b is required to achieve the white paper colour. The visible white colour is further enhanced by adding a fluorescent brightening agent, which, however, hinders PToF measurements. In the NIR range paper absorption at 1230 nm can be attributed to cellulose, which is consistent with that reported in the available published literature. The quality of any printing on paper is obviously strongly dependent on the absorption and scattering properties of the paper, clearly motivating the interest for such measurements. Quality assessment is of particular interest when using recycled paper with less known optical properties
Conclusions
The DOS technique provides insight into the chemical composition and physical properties of a broad diversity of turbid samples. This is accomplished by monitoring the optical absorption and scattering properties of the media. DOS has a strong advantage over many other equivalent techniques due to its speed, simplicity, non-invasiveness and cost. Diffuse optical spectroscopy has many highly viable applications in the fields of biomedicine, industrial and environmental analyses. Albeit highly useful in many situations, DOS may be tricky to implement as extensive calibration and maintaining of chemometric modelling is required in order to differentiate between absorption and scattering effects and interpret the results. The recent progress in source and detector technologies has triggered the development of advanced spectroscopic techniques that enable independent evaluation of absorption and scattering directly during the experiment. Such data obviously considerably simplifies spectroscopic data analysis, making the technique more robust and the results more accurate. Broadband PToF spectroscopy enables evaluating spectra of the absorption and scattering coefficients by monitoring and analysing propagation of spectrally tuneable probe pulses in the turbid sample. Here, using illustrative examples of the original experimental data within diverse application fields, we have discussed the basic principles of PToF spectroscopy. To demonstrate the unique capabilities of PToF spectroscopy we have also presented representative absorption and scattering spectra of milk, printing paper and, to the best of our knowledge, the first ever reported absorption and reduced scattering spectra of Edamer cheese.
References
- T. Svensson, E. Alerstam, D. Khoptyar, J. Johansson, S. Folestad and S. Andersson-Engels, “Near-infrared photon time-of-flight spectroscopy of turbid materials up to 1400 nm,” Rev. Sci. Instrum. 80 063105 (2009). doi: http://dx.doi.org/10.1063/1.3156047
- D. Khoptyar, A.A. Subash, S. Johansson, M. Saleem, A. Sparen, J. Johansson and S. Andersson-Engels, “Broadband photon time-of-flight spectroscopy of pharmaceuticals and highly scattering plastics in the VIS and close NIR spectral ranges,” Opt. Express 21, 20941 (2013). doi: http://dx.doi.org/10.1364/OE.21.020941
- I. Bargigia, A. Tosi, A.B. Shehata, A. Della Frera, A. Farina, A. Bassi, P. Taroni, A. Dalla Mora, F. Zappa, R. Cubeddu and A. Pifferi, “Time-resolved diffuse optical spectroscopy up to 1700 nm by means of a time-gated InGaAs/InP single-photon avalanche diode,” Appl. Spectrosc. 66, 944–950 (2012). doi: http://dx.doi.org/10.1366/11-06461
- E. Simon, F. Foschum and A. Kienle, “Time-resolved diffuse spectroscopy measurements using a hybrid Green’s function for the radiative transfer equation,” Proc. SPIE 8799, Diffuse Optical Imaging IV, 879906 (2013). doi: http://dx.doi.org/10.1117/12.2032527
- O.H.A. Nielsen, A.A. Subash, F.D. Nielsen, A.B. Dahl, J.L. Skytte, S. Andersson-Engels and D. Khoptyar, “Spectral characterisation of dairy products using photon time-of-flight spectroscopy,” J. Near Infrared Spectrosc. 21, 375–383 (2013). doi: http://dx.doi.org/10.1255/jnirs.1075
- A. Shaharin, E.K. Svanberg, I. Ellerstrom, A.A. Subash, D. Khoptyar, S. Andersson-Engels and J. Akeson, “Muscle tissue saturation in humans studied with two non-invasive optical techniques; a comparative study,” Proc. SPIE 9032, Biophotonics—Riga 2013, 90320K (2013). doi: http://dx.doi.org/10.1117/12.2044799