Graeme Clemens,a* Benjamin Bird,b* Miles Weida,b Jeremy Rowletteb and Matthew J. Bakera,c*
aCentre for Materials Science, Division of Chemistry, University of Central Lancashire, Preston, PR1 2HE, UK. E-mail: [email protected], [email protected]
bDaylight Solutions Inc., 15378 Avenue of Science, San Diego, CA 92128, USA. E-mail: [email protected]
cWestCHEM, Department of Pure and Applied Chemistry, University of Strathclyde, 295 Cathedral Street, Glasgow,
G1 1XL, UK. E-mail: [email protected]
Introduction
Mid-infrared spectroscopic imaging is a rapidly emerging technique in biomedical research and clinical diagnostics that takes advantage of the unique molecular fingerprint of cells, tissue and biofluids to provide a rich biochemical image without the need for staining. Spectroscopic analysis allows for the objective classification of biological material at a molecular level.1 This “label free” molecular imaging technique has been applied to histology, cytology, surgical pathology, microbiology and stem cell research, and can be used to detect subtle changes to the genome, proteome and metabolome.2–4 The new wealth of biochemical information made available by this technique has the distinct potential to improve cancer patient outcome through the identification of earlier stages of disease, drug resistance, new disease states and high-risk populations.4 However, despite the maturity of this science, instrumentation that provide increased sample throughput, improved image quality, a small footprint, low maintenance and require minimal spectral expertise are essential for clinical translation.
The latest generation of Fourier transform infrared (FT-IR) spectrometers, that incorporate large liquid nitrogen cooled focal plane array (FPA) detectors within an infrared microscope system, have no doubt accelerated the development of the field. An FPA detector is a 2D device that is sensitive to the infrared region of the electromagnetic spectrum and consists of an array of photon-sensitive pixels on the focal-plane of a lens.5 Significant improvements in data acquisition, processing and classification times, in part due to the increased field of view (FOV) of these FPA based devices, have enabled spectroscopic investigations that now include clinically relevant patient populations.6 Nevertheless, despite these marked improvements when compared to linear detector array (LDA) or point detector based systems, data collection times from tissue micro-array (TMA) cores or whole tissue sections are still of the order of hours or days.7 The problem can be characterised in part by the trade-off that must be made between spatial and spectral resolution, and the signal-to-noise ratio required to provide robust spectral classification. Utilising a low magnification objective increases the FOV and signal-to-noise ratio of the recorded data, thereby allowing larger areas of the sample to be imaged more rapidly. However, smaller spatial features within the sample cannot be resolved, so consequently there is a need for high definition, diffraction-limited, spatial resolution for the identification and classification of early stages of disease. However, without the photon throughput available from a synchrotron source, and the requirement of high magnification reflective optics that offer a much reduced FOV, acquisition times can dramatically increase to acquire images of adequate size and signal-to-noise ratio. Furthermore, the multiplex advantage exploited by traditional Fourier transform based systems can be computationally prohibitive, requiring large amounts of readout data to be processed before subsequent reduction to only a few key wavelengths or spectral biomarkers used for classification. This has led to a debate within the spectroscopic community as to whether all spectral frequencies need to be collected once a set of specific spectral biomarkers have been identified, and thus instead explore more efficient non-interferometric methods of data collection.
Quantum cascade laser based mid-infrared imaging
Recently, broadly tunable mid-infrared quantum cascade lasers (QCLs) have been successfully integrated within a microscope for spectrochemical imaging across the molecular fingerprint region.8 The main components of this type of microscope include multiple QCL modules, an optical multiplexer, a condenser, a switchable objective, an automated stage and an FPA detector system. No longer requiring an interferometer, simpler instrument architecture can be achieved allowing a reduced footprint; approximately a third of high-end commercial FT-IR bench and microscope systems.8 The high brightness of these broadly tunable QCL sources has also enabled the use of large format (480 × 480 pixels) uncooled microbolometer detector systems, removing the need for a cryogenically cooled mercury cadmium telluride (MCT) based detector system. Of particular note has been the development of purpose designed high numerical aperture (NA), achromatic, wide-field and refractive-based infrared objectives. The unique combination of a broadly tunable laser source, refractive-based objectives optimised for coherent light and a large format detector system has enabled high-definition diffraction-limited resolution, without a trade-off in signal-to-noise and field of view, as associated with FT-IR microscopes with their extended globar thermal light sources. Utilising a tunable laser as a source also provides new modalities of data collection not previously available. Real-time discrete frequency spectrochemical imaging at 30 frames per second is a modality that can provide a number of unique applications, allowing the user to quickly screen large samples, moving back and forth between a handful of important frequencies that enhance chemical contrast of the sample and help segment areas of disease. This type of modality would suit intra-operative tumour screening of frozen biopsy tissue or multiplexed chemotyping of cells or biofluids. Another unique modality is the ability to perform a sparse frequency data collection, whereby a target set of discrete frequencies can be collected. During the learning phase of a spectral diagnostic, it is clearly wise to acquire data from the full spectral range in order to mine the spectral patterns between class types. However, once the learning phase is complete, and the most diagnostic spectral features have been identified, a targeted list of only a few key wavelengths needs to be collected by the instrument, thereby greatly improving acquisition time and sample throughput.
High-resolution mid-infrared spectrochemical imaging of tissue
The current method for diagnosis of cancer is histopathology. This method requires a trained pathologist, often a specialist (e.g. neuropathologist), to interpret morphometric changes in cellular and tissue architecture to render a diagnosis. The technique has a long diagnostic window and can be prohibitively subjective.9 Limitations with this diagnostic modality have led to an interest in the development of spectroscopic analytical techniques for the diagnosis of cancer.10
All mid-infrared based microscope systems are inevitably limited by a trade-off between spatial resolution, signal-to noise ratio, field of view and acquisition time. Traditionally with a conventional bench-top FT-IR-based system, to achieve true diffraction-limited resolution, high magnification objectives with the largest possible NA are required that provide a much reduced field of view and extended sample dwell times to achieve an acceptable signal-to-noise ratio for tissue classification purposes.11 Previous rigorous analysis indicates that it is also imperative to provide an effective pixel spacing of ~l / 4 assuming the best commercially available NA of ~0.65. However, these calculations were based on models of a circular objective, whereas a classical Cassegrain objective is annular. Nevertheless, when combining high magnification objectives on the order of 36× and above, with a 128 × 128 pixels FPA detector system, the best FOV achievable is on the order of 150 µm × 150 µm with a pixel resolution of 1.1 µm. Given these limitations the application of high resolution imaging for spectral tissue classification has been limited, with a preference to perform lower resolution imaging with a larger FOV in order to increase sample throughput. More recently, however, the application of high resolution imaging for clinical diagnostics has shown clear advantages for the identification of small tissue structures that are essential for detecting early forms of disease.12 Traditional histochemical and immunohistochemical staining, despite their drawbacks of inter-observer variability of morphological interpretation, are still very reliable for gross tumour identification and subtyping, providing a difficult technology to disrupt with an infrared spectral diagnostic. However, mid-infrared spectral imaging is more likely to make a real and beneficial impact in pathology by identifying earlier forms of disease that cannot be identified by these methods, and are characterised by very small changes in the biochemical components of glandular, endothelial and myoepithlial cells, or intra-lobular stroma. Thus, a technology that can provide high fidelity spectral data at this scale is likely essential for clinical translation.
The recent development of the Spero™ microscope (Daylight Solutions Inc., San Diego, CA, USA), a laser-based mid-infrared microscope, provides the capability to perform diffraction-limited imaging across the molecular fingerprint region (900–1800 cm–1) although with a much enhanced FOV. By use of the high magnification refractive-based objective of this instrument, which has a NA of 0.7 and a magnification of 12.5x, a FOV of 650 µm × 650 µm can be achieved, with a sample-referred pixel size of 1.36 µm. This equates to a ~20× enhancement in the FOV, making high resolution imaging of samples a more viable option, and has been measured via a USAF (United States Air Force) military target and shown to achieve diffraction limited resolution of 5 µm at 1650 cm–1, corresponding to the peak of a typical Amide I band. A software communications upgrade will be released shortly that will further reduce the data acquisition time to approximately five minutes per tile for a data collection from 900 cm–1 to 1800 cm–1 at 4 cm–1 resolution.
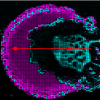
Figure 1 shows spectral images of the 1650 cm–1 band intensity recorded across medullablastoma and glioblastoma (types of brain cancer) tissue core slices (approximately 1.5 mm in diameter, 5 µm thickness, placed on CaF2 substrate) imaged using the QCL microscope system (A, C and E) and an FT-IR based microscope with a 128 × 128 pixels FPA detector system (B, D and F). Figures 1E and 1F show zoomed images of the areas highlighted by the white box in Figures 1C and 1D, respectively. Images were acquired by performing a 3 × 3 camera tile mosaic of each tissue core. The QCL microscope system utilised a 12.5× magnification objective with a NA of 0.7 to provide a FOV of 650 × 650 µm and a pixel size of 1.36 µm for each tile. Data was acquired from 900 cm–1 to 1800 cm–1 with a spectral resolution of 4 cm–1 and took 2.1 h. The FT-IR microscope utilised a 15× magnification objective with a NA of ~0.65 to provide a FOV of 700 × 700 µm and a pixel size of 5.5 µm for each tile. Data was acquired from 950 cm–1 to 3800 cm–1 with a spectral resolution of 4 cm–1, 1× zero filling factor, Blackman Harris apodisation and took 2.25 h. All spectroscopic data was acquired in transmission geometry.
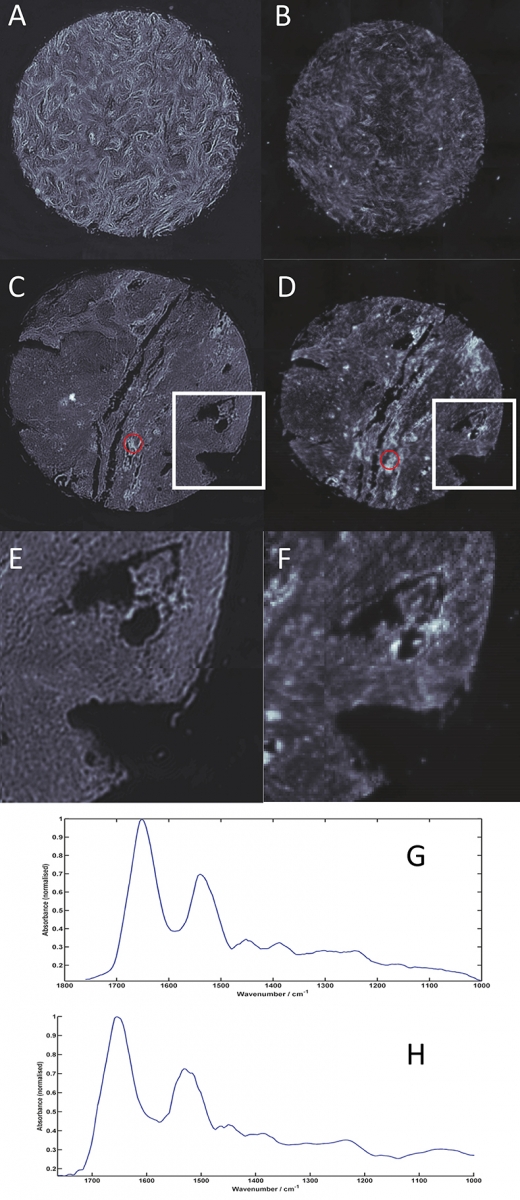
Figure 1. Spectral images of the 1650 cm–1 band intensity across medullablastoma (A and B) and glioblastoma (C, D, E and F) tissue cores (approximately 1.5 mm diameter and 5 µm thickness) imaged using a Spero QCL microscope (A, C and E) and a 128 × 128 FPA microscope system (B, D and F). 1E and 1F are zoomed images of the areas highlighted by the white boxes on 1C and 1D of the glioblastoma tissue core. Spectra from the areas highlighted in yellow on C and D are shown for the QCL microscope (G) and for the FT-IR microscope128 × 128 system (H
The higher-resolution data acquired using the QCL microscope system clearly provide images with superior clarity and allow fine tissue features to be visualised. By enabling small but important tissue features to be resolved, spectrochemical information can be unlocked to not only identify early and rare forms of diseases, but also isolated primary and metastatic tumour cells, providing the potential to uncover previously unavailable information for the clinical sphere. In addition, once a subset of diagnostic discriminatory frequencies has been identified (see biofluid section below), acquisition times can be markedly reduced since a QCL-based system can, as mentioned above, be tuned to only acquire data from frequencies of interest, and therefore allow more clinically relevant timescales to be achieved. This technology has a huge potential to help enable spectrochemical histopathology and drive forward the technique being applied in surgical pathology for highly important intra-operative decisions.
Wide-field mid-infrared spectrochemical imaging of biofluids
Biofluids (e.g. urine and serum) provide an easily accessible, relatively non-invasive sample for analysis, the collection of which can be performed worldwide and in the field.13 The application of mid-infrared spectroscopy to characterise and classify human biofluids is a rapidly emerging field with a multitude of researchers now providing strong evidence that both primary and metastatic cancers and other auto-immune diseases can be identified and robustly classified.14 The success is due in part by the application of a holistic approach, whereby the entire biochemical make-up of the biofluids is scrutinised, rather than a small subset of biomarkers that can often result in misleading interpretations.13 Research to date has been performed using a variety of different techniques, namely attenuated total reflection (ATR) and conventional imaging of dried biofluids spots.15–17 However, a viable spectroscopic method for high throughput multiplexed screening of large patient populations is still lacking. One route toward this goal could be the rapid infrared imaging of biofluid spots that have been prepared in a patient orientated grid map. For example, the x-dimension of such a grid could describe a patient’s biofluid profile from different organs or extracted biochemical components therein, and the y-dimension different patients. When utilising a sessile drop technique, circular films on the order of 1–2 mm in diameter are formed when using 0.5 µL of fluid; the smallest reliable measurement using handheld pipettes. The dried spots can describe variable topology, but provide what is more commonly known as the coffee stain effect, whereby a thick ring is formed on the surrounding edges of the spot. Within this ring the data recorded is often compromised since the absorbance intensities measured for protein bands can often be beyond the linear range of the detector response and show saturation. However, within the middle of the spot, a large area can be actively extracted for spectral analysis. What is also inherently different with dried biofluids, and somewhat advantageous over tissue or cell analysis, is the relatively homogenous sample morphology that in turn provides spectral data relatively free of adverse scattering. Spectral profiles show little, if any, broad baseline oscillation allowing robust classification algorithms to be constructed without rigorous scattering correction.
By use of the low magnification refractive-based objective of the QCL microscope system, which has a NA of 0.15 and a magnification of 4×, a FOV of 2 × 2 mm can be achieved. This objective allows an entire dried biofluid spot to be examined in a single camera shot, with a sample-referred pixel size of 4.25 µm and a spatial resolution on the order of 25 µm at 1650 cm–1. Given the homogenous nature of the sample deposition, spatial resolution is not an absolute necessity for this type of analysis, and the wide-field imaging capability allows for a more rapid assessment of the entire dried spot. Since these types of samples do not provide adverse scattering profiles they are also ideal candidates for a sparse frequency data collection protocol, whereby a reduced number of discrete wavelengths are targeted rather than collecting a more time prohibitive full spectrum.
Figure 2 displays spectrochemical imaging analysis of a spotted human serum sample prepared onto a CaF2 substrate. Each serum spot was deposited manually using a micro-pipette and 0.5 µL of sample per patient, to form a grid of 2 × 5 spots. The columns of the grid describe patients diagnosed as having a normal, brain, lung, breast and skin cancer diagnoses, respectively. Each deposited serum spot was ca 2 mm in diameter. The entire grid of serum spots was subsequently analysed using the wide-field 4× objective of the QCL microscope system using a discrete frequency collection protocol. Intensity values at 14 discrete wavenumbers (1000, 1030, 1080, 1482, 1520, 1546, 1570, 1600, 1630, 1654, 1686, 1726, 1734 and 1770 cm–1), associated with the peak maxima and shoulders of absorption bands associated with lipid, protein, nucleic acid and carbohydrate macromolecules, were recorded from a total of 24 frames in a total time of 50 min (ca 2 min per tile); these absorption bands have previously been shown to be salient discriminating bands when comparing ATR/FT-IR recorded spectra from cancerous and non-cancerous blood serum spots.16,17 The image in Figure 2A was constructed by plotting the recorded intensity value at 1654 cm–1 and allows the serum morphology to be easily visualised, often highlighting the coffee ring like shape of the serum deposits’ outer rims; spatial areas of the image mosaic highlighted as red correspond to high absorption at 1654 cm–1 and spatial areas of the image mosaic highlighted as blue correspond to no absorption or very little absorption at the 1654 cm–1. By use of a quality test that probes sample absorbance, a threshold criterion was utilised to extract pixels that were contained within the central part of the serum spots and did not describe saturation of the Amide I and Amide II protein specific bands. The remainder of the multivariate data (chemometric) analysis was performed on 11 discrete frequencies (1482, 1520, 1546, 1570, 1600, 1630, 1654, 1686, 1726, 1734 and 1770 cm–1), that predominantly describe protein and lipid profiles, in order to assess their ability to segment healthy from diseased patients. Figure 2B displays all extracted spectra after baseline correction and vector normalisation. Figure 2C conversely displays the average spectra calculated for the two normal (black) and two brain cancer (blue) serum spots. Even at this very basic mean spectrum level, spectral differences between these groups can be visualised. A more comprehensive chemometric analysis using all of the spectra extracted from the normal and brain cancer serum spots was performed using both principal component analysis (PCA), as shown in Figure 2D, and peak centroid analysis, as shown in Figure 2E. PCA analysis was performed using all 11 discrete frequencies of the data, whereas the peak centroid analysis was performed using the nine frequencies associated with the Amide I and Amide II bands alone. Each dot in the figures represents a single pixel spectrum, whereby the black colour denotes a normal diagnosis (3242 spectra), and the blue colour brain cancer (1899 spectra).
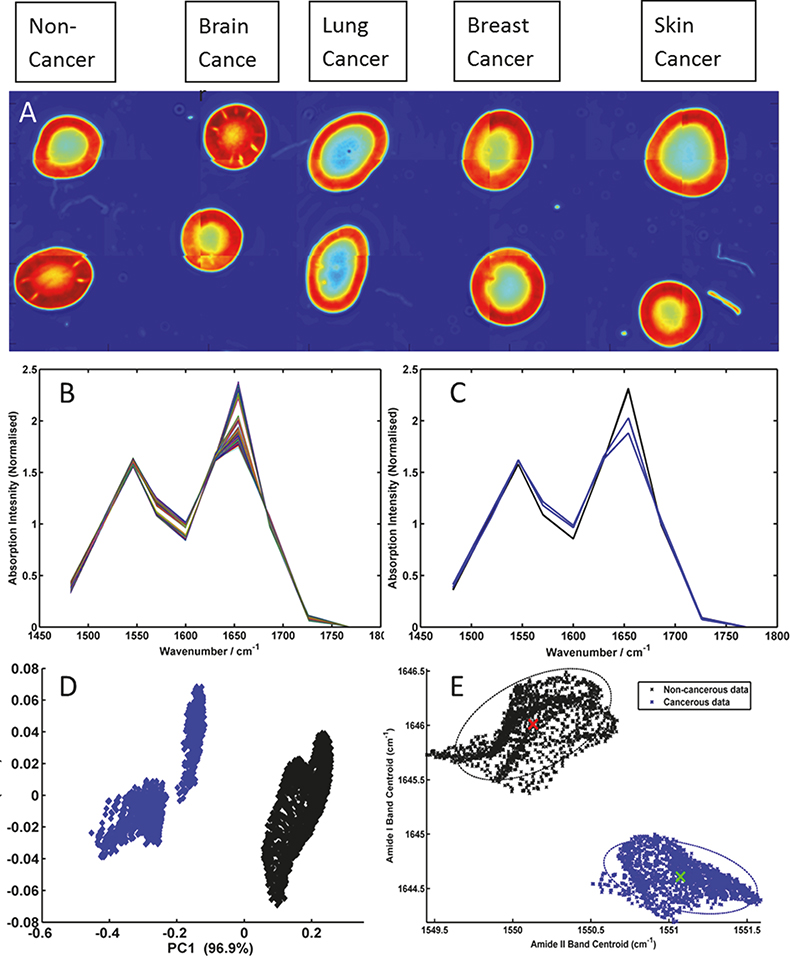
Figure 2. (A) Mosaic image of serum spots acquired using 14 discrete frequencies from non-cancer, brain cancer, lung cancer, breast cancer and skin cancer patients; (B) baseline-corrected and vector normalised serum spectra extracted from the centre of the non-cancer and brain cancer serum spots; (C) mean spectra from each non-cancer (black) and brain cancer (blue) serum spot; (D) PCA scores plot of brain cancer serum spectra (blue) and non-cancer serum spectra (black) and (E) peak centroid distribution plot of the Amide I and Amide II bands for the brain cancer (blue) and non-cancer (black) serum spectra.
These preliminary results (shown in Figure 2) clearly show that through recording data at a reduced number of wavelengths the structural shape of the Amide I and II absorption bands can still be maintained. Thus, band shifts in frequency and band structural shape changes due to disease state can still be captured from the recorded data. Therefore, the results highlight the time advantage that can be made when adopting a sparse frequency collection paradigm for diagnostic applications, with no resulting penalty in the accuracy of data classification. Salient features for the differentiation of non-cancer and brain cancer serum spots can be easily extracted with PCA and then targeted by a sparse frequency data collection, achieving robust classification using the shift in peak centroid of the Amide I and Amide II bands alone. Previous investigations of the serum samples used in this study, whereby spectral data was collected using a traditional FT-IR based system from the entire mid-IR window (4000–400 cm–1), identified the very same peaks and features as being implicated in the discrimination of disease states.16,17 However, such data sets comprised intensity values from over 900 wavelength dimensions, the overwhelming majority of which are not important for classification purposes, and can necessitate computationally expensive Fourier transformation and pertinent wavelength extraction. The use of a tunable laser-based microscope system has conversely allowed the focused acquisition of 14 pertinent mid-infrared spectral features required for classification, representing a step change in spectral image collection speed, within a clinically relevant time scale. Further studies are ongoing and include the utilisation of the nucleic acid and glycation associated discrete frequencies to segment multiple primary and metastatic cancers, which also utilise state of the art piezo-electric jetting devices for sample deposition.
Conclusions
The advent and application of QCL technology to the mid-infrared spectroscopic microscopic evaluation of biomedical samples is likely to rapidly expand over the next few years. The successful coupling of a tunable laser source with refractive based optics and large room temperature FPA cameras has opened a new door for practical spectral pathology. As evidenced in this contribution, spectroscopic images with a fidelity and definition relevant to clinical needs are now viable, and multiplexed imaging analysis can be performed using discrete frequency targeting protocols.
Acknowledgements
MJB and GC gratefully acknowledge the support of the EPSRC-funded Clinical Infrared and Raman Spectroscopy Network, CLIRSPEC (www.clirspec.org), (EP/L012952/1) for funding in order to undertake these experiments
References
- S.E. Taylor, K.T. Cheung, I.I. Patel, J. Trevisan, H.F. Stringfellow, K.M. Ashton, N.J. Wood, P.J. Kaeting, P.L. Martin-Hirsch and F.L. Martin, “Infrared spectroscopy with multivariate analysis to interrogate endometrial tissue: a novel and objective diagnostic approach”, Brit. J. Cancer 104, 790–797 (2011). doi: http://dx.doi.org/10.1038/sj.bjc.6606094
- G. Clemens, K.R. Flower, A.P. Henderson, A. Whiting, S.A. Przyborski, M. Jimenes-Hernandez, P. Bassan, G. Cinque and P. Gardner, “The action of all-trans-retinoic-acid (ATRA) and synthetic retinoid analogues (EC19 and EC23) on human pluripotent stem cells differentiation investigated using single cell infrared microspectroscopy”, Mol. Biosyst. 9, 677–692 (2013). doi: http://dx.doi.org/10.1039/c3mb25505k
- C. Petibois and G. Deleris, “Chemical mapping of tumor progression by FT-IR imaging: towards molecular hisopathology”, Trends Biotech. 24(10), 455–462 (2006). doi: http://dx.doi.org/10.1016/j.tibtech.2006.08.005
- I.W. Levin and R. Bhargava, “Fourier transform infrared vibrational spectroscopic imaging: integrating microscopy and molecular recognition”, Ann. Rev. Phys. Chem. 56, 429–474 (2005). doi: http://dx.doi.org/10.1146/annurev.physchem.56.092503.141205
- K.M. Dorling and M.J. Baker, “Rapid FTIR chemical imaging: highlighting FPA detectors”, Trends Biotech. 31(8), 437–438 (2013). doi: http://dx.doi.org/10.1016/j.tibtech.2013.05.008
- D.C. Fernandez, R. Bhargva, S.M. Hewitt and I.W. Levin, “Infrared spectroscopic imaging for histopathologic recognition”, Nature Biotech. 23, 469–474 (2005). doi: http://dx.doi.org/10.1038/nbt1080
- P. Bassan, A. Sachdeva, J.H. Shanks, M.D. Brown, N.W. Clarke and P. Gardner, “Whole organ cross section chemical imaging using label-free mega-mosaic FTIR microscopy”, Analyst 138, 7066–7069 (2013). doi: http://dx.doi.org/10.1039/c3an01674a
- J. Rowlette, M. Weide, B. Bird, D. Arnone, M. Barre and T. Day, “High-confidence, high-throughput screening with high-def IR microspectroscopy”, BioOptics World 7(2), 34-37 (2014).
- L.M. Fullwood, G. Clemens, D. Griffiths, K. Ashton, T.P. Dawson, R.W. Lea, C. Davis, F. Bonnier, H.J. Byrne and M.J. Baker, “Investigating the use of Raman and immersion Raman spectroscopy for spectral histopathology of metastatic brain cancer and primary sites of origin”, Anal. Meth. 6, 3498–3961 (2014). doi: http://dx.doi.org/10.1039/c3ay42190b
- M.J. Baker, E. Gazi, M.D. Brown, J.H. Shanks, P. Gardner and N.W. Clarke, “FTIR based spectroscopic analysis in the identification of clinically aggressive prostate cancer”, Brit. J. Cancer 99, 1859–1866 (2008). doi: http://dx.doi.org/10.1038/sj.bjc.6604753
- M.J. Nasse, M.J. Walsh, E.C. Mattson, R. Reninger, A. Kajdacsy-Balla, V. Macias, R. Bhargava and C. Hirschmugl, “High-resolution Fourier-transform infrared chemical imaging with multiple synchrotron beams”, Nature Meth. 8, 413–416 (2011). doi: http://dx.doi.org/10.1038/nmeth.1585
- M.J. Walsh, D. Mayerich, A. Kajdacsy-Balla and R. Bhargava, “High-resolution mid-infrared imaging for disease diagnosis”, Proc. SPIE 8219, Biomedical Vibrational Spectroscopy V: Advances in Research and Industry, p. 81920R (2012). doi: http://dx.doi.org/10.1117/12.909339
- M.J. Baker, “Photonic biofluid diagnostics”, J. Biophotonics 7(3–4), 151–152 (2014). doi: http://dx.doi.org/10.1002/jbio.201400504
- A.L. Mitchell, K.B. Gajjar, G. Theophilou, F.L. Martin and P.L. Martin-Hirsch, “Vibrational spectroscopy of biofluids for disease screening or diagnosis: translation from the laboratory to a clinical setting”, J. Biophotonics 7(3–4), 153–165 (2014). doi: http://dx.doi.org/10.1002/jbio.201400018
- J. Ollesch, M. Heinze, M. Heise, R. Behrnes, T. Bruning and K. Gerwert, “it’s in your blood: spectral biomarker candidates for urinary bladder cancer from automated FTIR spectroscopy”, J Biophotonics 7(3–4), 210–221 (2014). doi: http://dx.doi.org/10.1002/jbio.201300163
- J.R. Hands, P. Abel, K. Ashton, T. Dawson, C. Davis, R.W. Lea, A.J.S. McIntosh and M.J. Baker, “Investigating the rapid diagnosis of gliomas from serum samples using infrared spectroscopy and cytokine and angiogenesis factors”, Anal. Bioanal. Chem. 405(23), 7347–7355 (2013). doi: http://dx.doi.org/10.1007/s00216-013-7163-z
- J.R. Hands, K.M. Dorling, P. Abel, K.M. Ashton, A. Brodbelt, C. Davis, T. Dawson, M.D. Jenkinson, R.W. Lea, C. Walker and M.J. Baker, “Attenuated total reflection Fourier transform infrared (ATIR-FTIR) spectral discrimination of brain tumour severity from serum samples”, J. Biophotonics 7(3–4), 189–199 (2014). doi: http://dx.doi.org/10.1002/jbio.201300149