Karl H. Norrisa with A.M.C. Daviesb
Norwich Near Infrared Consultancy, 10 Aspen Way, Cringleford, Norwich NR4 6UA, UK. E-mail: [email protected]
Introduction
This column likes to be topical but we have only rarely published previously unpublished material. You may remember that that the previous column from Karl Norris1 was the first section of his lecture at the EAS conference last November. This column was supposed to be the second part of that lecture. I already had the figures and was waiting only for some text to accompany them, but Karl enjoys surprising people! This article is completely new and I suspect very few people have seen these spectra. In the four months since the conference Karl has discovered that his modified use of fourth derivatives has attributes that have surprised and excited him! Fourth derivatives are of course not new but what Karl has added is his interest in varying the gap size (which he has been successfully applying to second derivatives in NIR spectroscopy for many years). I hope you will enjoy reading this unusually rapid publication. I am confident that many NIR researchers will be re-examining their spectra (perhaps some from 20 years ago?) to view what they were previously unable to see.—Tony Davies
Sample temperature
The first set of spectra were collected more than 20 years ago to study the effect of temperature on the near infrared (NIR) spectra of starch.2 They include transmission spectra of the sample with a pathlength of 0.2 mm and a temperature range of +60°C to –80°C. The data available at this time are in digital format with two transmission spectra for each temperature over the wavelength range from 1000 nm to 2638 nm, and a data spacing of 1.6 nm. Figure 1 shows the spectra as absorbance, and the temperature effect is obvious in the 1400–1700 nm and the 1900–1960 nm regions. All spectral conversions were performed with Unscrambler 10.2, and Figure 2 shows the starch spectra converted with the gap derivative option with a gap of five points. A peak at 1934 nm is apparent for the temperature of –80°C, and as the temperature is increased this band becomes smaller, and a band at 1908 nm becomes larger. These bands are from the water bound into the starch molecule. The previous interpretation has been that the water band shifted to a shorter wavelength as the temperature increased, but these data clearly demonstrates the presence of two bands which vary in magnitude as the temperature changes. In the original study the spectra of a mixture of water and glass beads were measured to observe the effect of freezing on the spectra of water. As reported, the water with the glass beads showed a band at 2005 nm for temperatures below zero. Unfortunately, the digital data for the glass beads have not been recovered so we cannot show the derivative spectra, but it is clear from Figure 2 that the starch does not have the band at 2005 nm. This confirms the previous observation that the water in the starch does not freeze at temperatures as low as –80°C. The original experiment included spectra of microcellulose, which also showed that the water in this sample did not freeze. Examining the cellulose spectra with a fourth derivative, shows a surprising effect on the spectra greater than 2000 nm, as shown in Figure 3. Two clear bands at 2120 nm and 2130 nm vary in amplitude as the temperature changes. These bands have not been identified, and they are absent in the starch spectra. Other bands are apparent in the 1400–1700 nm region for both the starch and cellulose, but the discussion of these bands is beyond the scope of this introductory presentation.


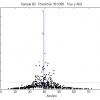
Another set of old data is that of 198 wheat samples representing most of the wheat samples from all of the wheat-production areas of the US. These data have been used in several research reports.3,4 Figure 4 shows the Log(1/R) for the total set of 198 samples. Most of the variations in the spectra are from differences in pathlength caused by the differences in the scatter properties common to ground wheat of different levels of hardness. Converting these spectra, Figure 5, to the fourth derivative with a gap of three shows two finite bands at 1908 nm and 1932 nm, which we assume are from water in the samples.


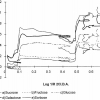
Theses samples had all been stored for more than six months in a low-humidity environment, so they should have very small differences in moisture content. The moisture bands will have small variations in magnitude from the differences in pathlength. To emphasise the advantage of the fourth derivative over the second derivative, Figure 6 shows both with a baseline offset for the fourth derivatives for plotting. Please note that the second derivative does not separate the water band into two bands as the fourth derivative clearly shows. The fourth derivative plots in Figure 7 clearly shows the variation in magnitude at the two protein wavelengths at 1976 nm and 2054 nm keeping in mind that the protein content varied from 9.0% to 18.4%. Many other differences over the total spectral range are available for study.


Sulfate salts show interesting spectra changes with temperature, and copper sulfate was chosen to show the merits of the fourth derivative. Figure 8 shows the interactance spectra5 for a sample of copper sulfate with a temperature variation of 2°C to 24°C. Interactance is a technology to measure the diffuse radiation with a special reflectance probe that minimises the surface reflection from the sample. This sample was measured using an interactance probe on a Foss-NIRSystems 6500 spectrometer for the spectral region from 1100 nm to 2500 nm. Temperature effects are most apparent in the 1900–2000 nm region. Converting to the fourth derivative with a gap of four points, gives the surprising temperature effects of Figure 9. There is a shift of about 2 nm at 1952 nm, but a band at 1906 nm is very temperature sensitive, and temperature effects are evident in the 1350–1550 nm region as well as in the 2000–2400 nm region. Concentrating on the bands in the 1900 nm region an expanded plot in Figure 10 shows the peak at 1906 nm shifting to 1912 nm at the highest temperature. The magnitude of this band varied with temperature, but not in a consistent fashion.


Sample composition
A set of six different flour samples from nuts.com were measured in transmission with the sample thickness chosen such that the maximum absorption was within the range of 2.8 to 4.2. The sample thickness was determined by a trial and error procedure, and four different preparations were made from each of the six different samples. The transmission spectra were measured with a Foss-NIRSystems Tablet Analyzer coupled to a model 6500 spectrometer with a scan from 600 nm to 1900 nm, and a data spacing of 2 nm. All spectra were measured in a normal laboratory environment, and the sample temperature was not controlled. The spectra of the raw data in Figure 11 show very little information about the constituents, and are dominated by the difference in pathlength, because the sample thicknesses for each scan were different. Converting the spectra to the fourth derivative with a gap of five points provides spectra with many well defined bands (Figure 12). The magnitude of the bands again show the effect of pathlength, but an interesting combination occurs in the 1200 nm region. In Figure 13 the spectra are plotted after applying a normalisation at a selected wavelength of 1210 nm. This normalisation should provide correction for the differences in the pathlength, and it appears to do an excellent correction. The identification of the different samples as provided by nuts.com are included, and note that every spectrum within each sample set matches well enough that the data for a single wavelength at 1196 nm can be used to classify the samples. We hope that someone can identify the absorption bands involved in these spectra.


Conclusion
The fourth derivative with a carefully chosen gap can be used to enhance NIR spectra. It appears particularly valuable for understanding the effects of sample temperature on NIR spectra. Instrument noise limits the quality of the fourth derivative data, but current instruments are adequate for many useful measurements. The authors are grateful to Dr Stephen Delwiche for providing access to 10 and 20 year old spectral data.
References
- K.H. Norris and A.M.C. Davies, “Examining diffuse reflection and transmission spectra more thoroughly: Part 1. Instrument noise”, Spectrosc. Europe 23(6), 24 (2011).
- S.R. Delwiche, K.H. Norris and R.E. Pitt, “Temperature sensitivity of near-infrared scattering transmittance spectra of water-adsorbed starch and cellulose”, Appl. Spectrosc. 46, 5 (1992). doi: 10.1366/0003702924124781
- S.R. Delwiche and R.A. Graybosch, “Examination of spectral pretreatments for partial least-squares calibrations for chemical and physical properties of wheat”, Appl. Spectrosc. 57, 1517 (2003). doi: 10.1366/000370203322640161
- S.R. Delwiche and J.B. Reeves, “The effect of spectral pre-treatments on the partial least squares modelling of agricultural products”, J. Near Infrared Spectrosc. 12, 177 (2004). doi: 10.1255/jnirs.424
- J.M. Conway, K.H. Norris and C.E. Bodwell, “A new approach for the estimation of body composition: infrared interactance”, Am. J. Clin. Nutr. 40, 1123 (1984).