Nathan Hulme and John Hammond
Starna Scientific Ltd Hainault Business Park, 52/54, Fowler Rd, Ilford IG6 3UT, UK
Introduction
European Pharmacopoeia (EP) Chapter 2.2.25 on ultraviolet and visible spectroscopy (or spectrophotometry) has been extensively revised in both detail and scope and the new Edition 10.01 (10.0) is mandatory from 1 January 2020. A major change is that the scope is now extended to include high-performance liquid chromatography (HPLC) detectors and process analytical technology (PAT) as applications of ultraviolet/visible (UV/vis) spectrophotometry. This is a considerable divergence from the latest US Pharmacopeia (USP) Chapter <857>2 on Ultraviolet-Visible Spectroscopy, mandatory from 1 December 2019, that specifically excludes HPLC detectors from its scope. HPLC and PAT are both more dynamic and system-specific techniques than basic spectrophotometry, with more variables to consider, so, for reasons of simplicity, this article covers the new regulations only in so far as they apply to basic spectrophotometry. The new Edition introduces some new approaches to instrument qualification and suggests new reference materials for qualification measurements.
The significant changes to the standard, and their practical implications for instrument users are discussed below.
General measurement principles
This topic was largely absent from the previous Edition 9.23 (9.2) but has been extensively re-written and expanded for 10.0. While much of this section describes well-known aspects of UV/vis measurement, there are some new specific points to note:
Definition of UV/vis: For the purposes of the EP, the UV region is now defined as from 180 nm to 400 nm and the visible from 400 nm to 800 nm.
The user is recommended to: “Define the measuring conditions to obtain a satisfactory signal-to-noise ratio and to select the scan range, scan rate and slit-width that provide the necessary optical resolution for the intended application without losing the required signal-to-noise ratio or the linearity of the analytical method.” This is, of course, just good practice, but it is also suggested that when using diode array instruments, “there is no need to adjust the beam size, scan range, scan rate or slit-width since the optical resolution is typically fixed and the full spectrum is always recorded”. What is to be done if these fixed parameters do not yield a suitable signal-to-noise or linearity is not explained.
Cells (cuvettes)
Requirements for the optical quality of cells have been revised. A path length tolerance of ±0.005 cm was specified in 9.2. This is amended to ±0.5 %, which of course equates to ±0.005 cm for a 1-cm cell but becomes problematic when applied to much shorter path length cells.
While the ±0.5 % tolerance for a 10-mm path length is well within the practical capabilities of most cuvette suppliers, as the path length reduces the ±0.5 % tolerance becomes impractical. This would mean the tolerance on a 1-mm path length cell would be ±5 µm, where even the most reputable suppliers only quote a tolerance of ±10 µm. While ±5 µm is possible, it would add considerably to the cost, making such cells uneconomic as a day-to-day tool. Furthermore, taken to its logical conclusion a cuvette with a path length of 10 µm would have an unmeasurable tolerance of ±0.05 µm. This puts the user in a difficult position simply because applying a simple percentage does not work in practice. There was also a requirement in 9.2 that “When filled with the same solvent, the cells intended to contain the solution to be examined and the compensation liquid must have the same transmittance”. The term “the same” is not quantifiable and is now clarified in 10.0: “Cell absorbance <0.093 A @240 nm for a quartz cell, <0.035 A @650 nm for a glass cell; and when rotated 180° in the holder, an absolute difference <0.005 A.”
Control of equipment performance
The instrument qualification required for compliance is defined in 10.0 by the purpose of the analysis being carried out as shown in Table 1, taken from the standard.
Table 1. Minimum tests to be carried out for the control of equipment performance (Reproduced from Table 2.2.25.-1 in Reference 1).
Purpose | Method | Wavelength accuracy | Absorbance accuracy | Photometric linearity | Stray light | Resolution/spectral bandwidth |
Quantitative or limit test | Based on measurement of the absorbance at one or more identified wavelengths (e.g. assay or impurities test) | X | X | X | X | If required in the monograph |
Identification test | Based on wavelength of absorption maxima and minima | X | — | — | X | — |
Based on absorption measurement and wavelength of absorption maxima | X | X | — | X | — | |
Based on comparison of spectrum with that of reference substance | X | X | — | — | — |
Table 1 implies that instrument bandwidth is not important for qualitative analysis, but it should be remembered that if the spectra being examined contain sharp or complex absorption bands, the measured wavelength and absorbance of the peaks may be dependent on the resolution of the spectrophotometer, and may appear to shift simply due to the ability of the instrument, or lack of it, to resolve adjoining spectral features. Caution should, therefore, be exercised in such cases and it may be that a resolution qualification process is to be recommended.
The previous Edition of the standard contained a simple set of tests to evaluate an instrument’s performance for wavelength and absorbance accuracy, stray light and resolution. If an instrument passed these tests it could be claimed to be “pharmacopoeia compliant”. This approach has the potential weakness that an instrument qualification carried out under one set of operating conditions might not be valid for an analysis carried out using different conditions. For example, a qualification carried out in the UV using a deuterium lamp as source might not describe what would happen if the actual analysis were to be performed in the visible region using a tungsten halogen source. While the new standard requires the same parameters to be qualified, the requirement is now to demonstrate that the instrument has the necessary performance to carry out the actual analysis. This has always been a general requirement of GxP protocols, but not explicitly stated until now. The user must, therefore, determine the range of parameter values over which the system will be used in the analysis and demonstrate compliance over that range. One consequence of this is that the simplistic approach often adopted in the past—one qualification test for each parameter—may not suffice. Indeed, the standard now also requires that photometric linearity be qualified; this will certainly mean that more than one reference material with accurate absorbance values will be needed. The standard also recommends that the assigned parameter values of the references used for qualification should “bracket” the values to be used in the proposed analysis, so that a laboratory conducting several different assays may need to choose a range of different reference materials to demonstrate full compliance. These may be either purchased “certified reference materials” (CRMs) such as solid filters or liquid filters in appropriate sealed cells, or “solutions prepared in the laboratory”. CRMs have several advantages over laboratory-prepared solutions, and this will be discussed later.
Control of wavelength accuracy
The user is required to:
“Control the wavelength accuracy of an appropriate number of bands in the intended spectral range using one or more reference materials”
and
“It is recommended to test at least 2 wavelengths that bracket the intended spectral range”
A selection of reference materials is proposed, with peak wavelengths (see Table 2).
Table 2. Examples of wavelengths used for the control of wavelength accuracy (Reproduced from Table 2.2.25.-2 in Reference 1).
Material | Peak wavelengths (nm) |
Solutions: | 201.1; 211.4; 222.6; 240.4; 253.7 |
Solid filters: | 513.5 |
Lamps: | 486.0; 656.1 |
All the solutions and solid filters are commercially available as CRMs. Note that the spectra of the rare earth elements used in these materials contain sharp peaks, so the measured peak wavelength may vary with instrument resolution. Good wavelength CRMs will have wavelengths certified at different bandwidth values, and the user should qualify the instrument using the bandwidth specified in the analytical monograph.
Holmium oxide solution has been used as a wavelength reference for many years, but for wavelengths below 240 nm cerium oxide solution, with peaks down to 201 nm, is now recommended for this “far UV” region.
Glass filters might be considered to be more robust than liquid references in cuvettes, but wavelength intensity values can vary slightly from melt to melt so such filters should be individually certified. Solution cell filters can be cleaned (with care), as an optically polished quartz surface can be returned to a “clean” optical characteristic; however, this is not recommended for glass filters as by definition, cleaning may change the characteristics of the optical surface, and thereby invalidate the certification.
Atomic spectral lines such as those of mercury, neon or xenon are a primary physical standard and the ultimate wavelength reference and as such are always cited as suitable for instrument qualification. Caution is needed, however, as the US Pharmacopeia Chapter <857> notes: “The arc of the atomic emission source, or its image, needs to be located on the same optical path as the image of the primary light source of the spectrometer; thus, it can be used only in spectrometers that can be operated in a single-beam intensity mode and practically should be implemented only on a system designed to accommodate these sources”. The built-in deuterium and xenon lamps often used as spectrophotometer light sources are on the optical path and have emission lines that can provide a useful routine wavelength check if the instrument is capable of single-beam operation. Note, however, that only visible wavelengths are referenced, so they are unsuitable for UV qualification.
The list above is not prescriptive, so if qualification is required for which none of the recommended materials is suitable, other CRMs are available and can be used. For example, for those needing qualification at even lower UV wavelengths, a “Deep UV” CRM4 is available from a leading Reference Material Producer (RMP), with certified peaks down to 191 nm. Some simple instruments having a wide spectral bandwidth may be unable to resolve the sharp bands of the listed references, and for such cases a specially formulated “Green dye solution”4 offered by one RMP is a CRM that can be used to qualify wavelength (and absorbance) at bandwidths up to 12 nm.
Whatever references are used, the EP’s permitted tolerance for benchtop spectrophotometers is ±1 nm for wavelengths below 400 nm, and ±3 nm for 400 nm and above.
Control of absorbance accuracy
This section of 10.0 introduces several changes to traditional practice and in places is open to interpretation.
Potassium dichromate solution in acidic media has been the absorbance reference material of choice for many years and was cited in 9.2 for qualification at 235, 257, 313, 350 and 430 nm. Laboratories had the option to use commercially available CRMs and most regulated laboratories will probably already have one or more of these references. It is, however, not cited in the latest Edition, which now suggests nicotinic acid solutions. The EDQM website also states that 10.0 includes:
“introduction of nicotinic acid as an alternative to potassium dichromate (REACH Annex XIV)5 for control of absorbance accuracy”.
This implies that potassium dichromate constitutes a hazard to operators, but a detailed review of the REACH regulations,6 shows that the risk, even if preparing potassium dichromate solutions in the laboratory, is vanishingly small at the concentrations and quantities used for instrument qualification and is non-existent when using commercially supplied CRMs in permanently sealed cells—the form in which most laboratories already hold this reference.
Furthermore, nicotinic acid cannot be regarded as an “alternative” to potassium dichromate except in certain defined situations. First, potassium dichromate can be shown to be a more universal absorbance reference, as it can be certified at five well-spaced wavelengths over a much wider wavelength range (235–430 nm) compared to just two wavelengths for nicotinic acid, 213 nm and 261 nm. There is, therefore, more scope to “bracket” the analytical wavelength as recommended in the standard. Second, and perhaps more important, the nicotinic acid spectrum is significantly affected by spectral bandwidth. Figure 1 shows the effect of bandwidth on the measured values of nicotinic acid solutions and of potassium dichromate solutions at different bandwidth settings.
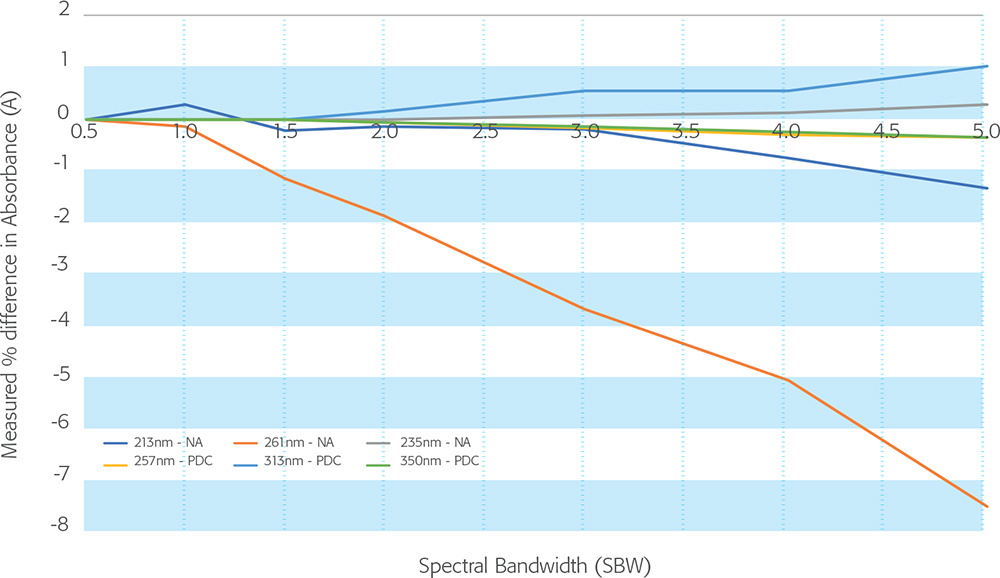
Figure 1. Effect of spectral bandwidth on measured absorbance values of nicotinic acid and potassium dichromate solutions. Nicotinic acid (NA) @ 213 nm and 261 nm vs acidic potassium dichromate (PDC) solution @ 235 nm, 257 nm, 313 nm and 350 nm.
It can be seen that the absorbance value of the nicotinic acid peak at 261 nm, recommended here for instrument qualification, is severely affected by bandwidth—indeed the effect is much greater than the tolerance allowed for compliance. The values for potassium dichromate at similar wavelengths are affected much less.
It is important, therefore, that qualification measurements using nicotinic acid are made at the same bandwidth setting as those used to establish the values for the reference material. 10.0 gives a procedure for the preparation of reference solutions from “nicotinic acid for equipment qualification CRS”. This material is available as a solid from EDQM. Having prepared the solutions as directed, the user then calculates the reference absorbance values from the “specific absorbance” given in the accompanying certificate. Unfortunately, the variation allowed in the weight of solid to be used will lead to an inexact concentration of the final solution and hence an incorrect calculated absorbance. Furthermore, the certificate gives no indication of the bandwidth used to determine the specific absorbance, so the certified value is fairly meaningless. An instrument could fail to achieve compliance simply because the qualification measurements were unknowingly made using a spectral bandwidth different from that used to determine the certificate value. No guidance is given on the stability or validity period of the solutions once prepared. Use of this material, as described in 10.0, is, therefore, unlikely to be valid as an absorbance reference. Fortunately, commercial nicotinic acid CRMs are available and can usually be certified at any bandwidth requested by the customer. Used correctly, nicotinic acid is a useful absorbance reference in the far UV but cannot replace potassium dichromate at higher wavelengths.
For compliance, the allowed difference between the measured absorbance and the actual absorbance of the reference material is ±0.010 A or ±1 %, whichever is greater, and “values at approximately the two limits of the expected absorbance range should be verified”. This tolerance applies to absorbance values up to 2 A, and it is suggested that higher absorbances are dealt with “on the basis of a risk assessment”, for which no further details are provided. In this context, both nicotinic acid and potassium dichromate CRMs are available with traceable certified values up to 2.5 A and 3.5 A, respectively, so direct qualification can be carried out with confidence at these higher levels (Figures 2 and 3).
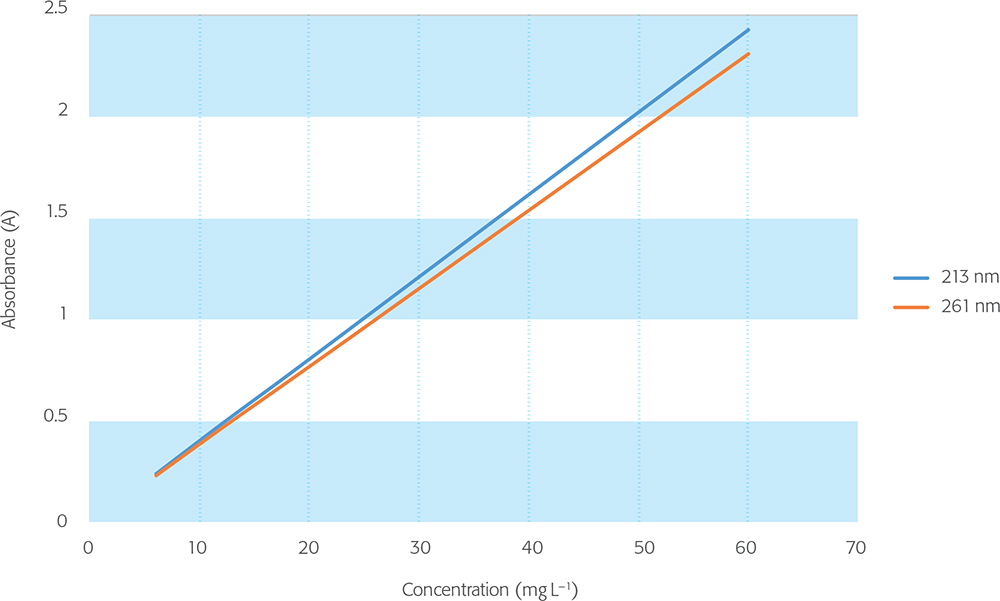
Figure 2. Nicotinic acid linearity.
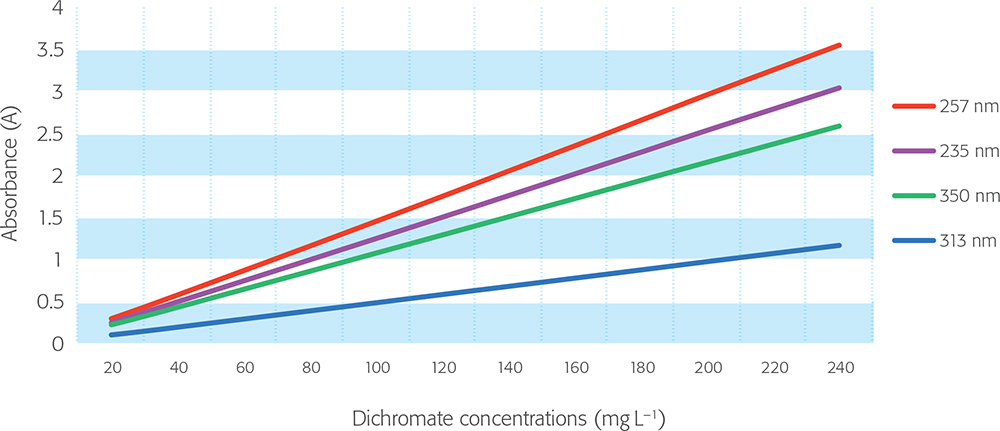
Figure 3. Potassium dichromate linearity.
Control of photometric accuracy and/or linearity in the visible region can be achieved using solid glass filter CRMs, but unlike the previous version (9.2) no specific guidance is given with respect to standards for the visible region other than to say that “suitable solid or liquid filters” can be used. The comments made above for wavelength also apply here, so CRMs other than those suggested may be used if they better match the operating conditions used for analysis.
Control of photometric linearity
This is a new requirement in 10.0. The references used to qualify absorbance accuracy can be used to qualify linearity provided they are compatible with the analytical wavelength and absorbance ranges. Nicotinic acid is cited as an example over the range 5-40 mg L–1. The number of references to be measured over the required absorbance range is not stated, but the coefficient of determination (R2) is given as 0.999 for compliance. How this requirement is met is left for the laboratory to decide. Fortunately, there is a definitive, internationally recognised ISO standard, ISO 11095,7 “Linearity Calibration using Reference Materials”, which states that the number of references used to assess a calibration function should be at least three. Similarly, the latest USP Chapter <857> simply states that at least three references bracketing the required absorbance range should meet the required absorbance accuracy criteria. Three will probably suffice for a limited absorbance range, say up to 1 A, but users may decide to use more when using higher absorbances. When using CRMs, users should remember to compare measured values with certified values and not with concentrations when assessing linearity.
Control of stray light
The standard says: “Stray light is determined at an appropriate wavelength using suitable solid or liquid filters or solutions prepared in-house”. The previous Edition (9.2) named just one stray light reference, namely 12 g L–1 potassium chloride solution, a cut-off filter that indicated stray light at 198 nm. Now, four different aqueous solutions are identified that can allow stray light to be detected over a wavelength range from 198 nm to 370 nm (Table 3).
Table 3
Material | Concentration | Absorbance at wavelength |
Potassium chloride | 12 g L–1 | ≮2.0 A at 198 nm |
Sodium Iodide | 10 g L–1 | ≮3.0 A at 220 nm |
Potassium iodide | 10 g L–1 | ≮3.0 A at 250 nm |
Sodium nitrite | 50 g L–1 | ≮3.0 A at 340 nm |
The test is to be conducted using a water blank cell, and it is observed that “the instrument parameters used for the test, such as slit-width and type of light source (e.g. deuterium or tungsten lamp), must be the same as those intended for the actual measurements”. All these reference materials are available as CRMs.
Control of resolution (spectral bandwidth)
This test remains the same as in the previous Edition. Where prescribed in a monograph, the resolution of the instrument can be determined by recording the spectrum of 0.02 % v/v toluene in hexane (or heptane), which produces a spectrum with an absorbance maximum at 269 nm and a minimum at 267 nm. The ratio of the maximum at 269 nm to the minimum at 267 nm should be as stated in the monograph. For general guidance, however, Figure 4 shows typical spectra obtained at different bandwidths—a useful guide to instrument bandwidth is shown in Table 4.
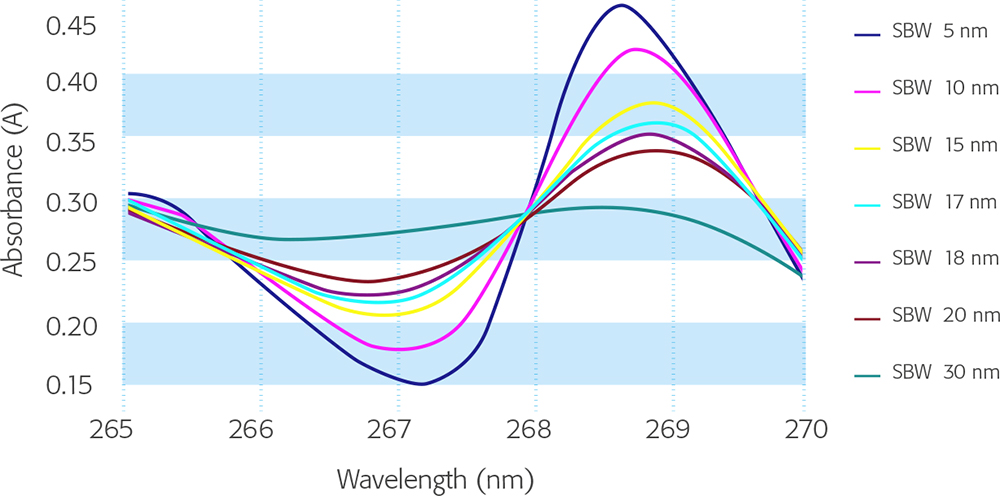
Figure 4. Spectra of 0.02 % v/v toluene in hexane at different spectral bandwidths.
Table 4
Ratio | 2.4 : 2.5 | 2.0 : 2.1 | 1.6 : 1.7 | 1.3 : 1.4 | 1.0 : 1.1 |
Spectral bandwidth (nm) | 0.5 | 1.0 | 1.5 | 2.0 | 3.0 |
Heptane, with lower toxicity than hexane, is proposed as an alternative solvent. This is not an issue, however, if the test material is purchased as a sealed-cell CRM.
The resolution test recommended for derivative spectroscopy is no longer included in the standard.
System suitability
This new section states that:
“System suitability tests may be required prior to sample measurement to verify critical parameters which may have an impact on the result. These tests may cover wavelength accuracy, absorbance accuracy, stray light and photometric linearity. System functionality tests, for example those performed as part of equipment auto testing, may be considered part of the system suitability tests.”
Several spectrophotometer models incorporate some degree of automatic self-test facility. A typical example is to use the source lamp (deuterium or xenon) emission lines to provide a wavelength check. As indicated above, however, these checks are only in the visible region, and users will have to decide whether such tests can “verify critical parameters” to the degree required. If not, the implication is that some or all the qualification tests previously described may also need to be performed along with the analysis.
Reference materials: CRM or prepared in-house?
Until the 1970s most laboratories used in-house prepared solutions or proprietary test materials to check the performance of their instrumentation or relied on the manufacturer to calibrate their instruments as part of routine maintenance. Now, the international nature of regulation requires that calibrations must have international validity, which means using universally recognised standards for calibration purposes. CRMs, prepared by accredited suppliers according to international norms, have that validity. It is still perfectly possible for instrument users to prepare their own reference solutions, and instructions are given in this standard, but compared with the use of CRMs this can be a complex process with many pitfalls. Clearly the accuracy of the reference value will depend on the purity of the materials used and the accuracy of preparation processes such as weighing and dilution. It is, therefore, normal to establish an “uncertainty budget” for the preparation of the standard and hence the overall uncertainty in the reference value, but this can also be complicated.8 It is perhaps not surprising that most laboratories decide to use commercial CRMs, where all this has already been done and the uncertainty is stated on the certificate.
What is a CRM?
As defined by ISO/REMCO (the International Standards Organisation Committee on Reference Materials), a CRM is a “Reference Material, characterised by a metrologically valid procedure for one or more specified properties, accompanied by a reference material certificate that provides the value of the specified property, its associated uncertainty, and a statement of metrological traceability.”9
Originally, the only available references for spectrophotometer calibration with internationally accepted property values were those from National Metrology Institutes (NMIs) such as the National Institute of Standards and Technology (NIST) in the USA, whose products were trademarked as Standard Reference Materials (SRMs). In any case, the advent of Good Laboratory Practice and similar quality schemes led to an increase in the demand for SRMs that exceeded the production capacity production capacity of the NMIs. Commercially produced reference materials were available but not necessarily accepted by regulatory authorities, so some producers collaborated with the regulators to develop reference materials that would be recognised as equivalent to SRMs for calibration purposes. Such materials would be known as CRMs and would be recognised by national and international regulators or accreditation bodies. These CRMs can be produced as solutions, supplied permanently sealed into UV quality cells for direct qualification measurements. Not only does this free the user from the task of preparing the reference solutions, but virtually eliminates any hazards that might arise from directly handling the reference materials.
Furthermore, unlike in-house reference materials, the certified value of a CRM does not rely on the accuracy with which the reference material has been prepared, but on a calibration performed on a reference instrument that has itself been calibrated against primary physical standards or SRMs. The certificate values are of course subject to any variability of the calibration instrument, but this can be established by the producer and stated on the certificate that accompanies the CRM. The “expanded uncertainty budget” normally given in the calibration certificate is the uncertainty to be expected in the measured parameter and is conventionally stated with a 95 % confidence level.
Armed with this information, instrument qualification becomes very straightforward. When a CRM is used to qualify an instrument, the total allowed tolerance is the sum of the certificate uncertainty and the instrument manufacturer’s specified accuracy of the instrument, Table 5.
Table 5
| Wavelength | Absorbance |
Certificate uncertainty budget | ±0.10 nm | ±0.0049 A |
Instrument specification | ±0.30 nm | ±0.0050 A |
Total tolerance | ±0.40 nm | ±0.0099 A |
If the difference between the measured value and the certified value is less than the total tolerance, the instrument can be judged to be operating correctly. The difference should, of course, also be less than the error permitted by the pharmacopoeia or the analytical monograph in use.
Nowadays, most instrument qualification in the pharmaceutical industry is performed using CRMs. Indeed, the United States Pharmacopeia states in its Chapter <857> that “Wherever possible… CRMs are to be used in preference to laboratory-prepared solutions”. Sets of CRMs are available tailored to the new regulations, an added convenience of this approach.
Traceability is very important as it lends to the CRM the authority of the internationally recognised references to which its calibration can ultimately be traced. It is defined in ISO/IEC Guide 99:200710 as the “property of a measurement result whereby the result can be related to a reference through a documented unbroken chain of calibrations, each contributing to the measurement uncertainty”. The reference spectrophotometers used by CRM suppliers to establish the certified values must, therefore, be qualified against suitable SRMs or against primary physical references such as elemental emission lines. The references used should be identified on the certificates accompanying the CRM.
The stability of the reference material is also very important, and the validity of the calibration should be stated on the CRM certificate. This is typically two years, but may be less depending on the laboratory’s quality protocols. Recertification should be performed periodically to maintain the validity of the certification.
For users to have confidence in purchased CRMs, their suppliers should be properly accredited to ISO 17034:2016 “General requirements for the competence of reference material producers”.11 This is the minimum requirement and covers quality and administration systems and technical and manufacturing operations. This standard includes normative references to another standard: ISO/IEC 17025:2017 “General requirements for the competence of testing and calibration laboratories”.12 ISO 17025 specifies the procedures for reporting and evaluating measurement uncertainty and any competent producer should be accredited to this standard also. ISO 17025 accreditation includes a statement of its “scope”, listing the reference materials the laboratory is competent to calibrate. Intending purchasers should check that their proposed supplier’s accreditation scope includes the material in question: accreditation to ISO 17025 could be claimed on the strength of just one material or calibration process, which might not cover the item to be purchased.
Conclusions
Like the new USP Chapter <857>, Edition 10.0 of EP 2.2.25 has been considerably expanded to put more emphasis on the “fitness for purpose” of UV/vis instrumentation. Instruments must now be shown to have the necessary performance to function adequately under the operating parameters to be used for analysis. To this end, examples of suitable reference materials are given, but the suggested materials will not cover all situations. There are also uncertainties in the interpretation of the standard, notably in the sections dealing with absorbance accuracy and linearity. Nicotinic acid is suggested as an absorbance reference, but the data given for its preparation is flawed as it is inexact and does not acknowledge the effect of spectral bandwidth. One of the new specifications (cell path length) is unachievable in many instances in practice. Fortunately, however, the standard does allow the use of the very wide range of CRMs now commercially available for instrument qualification. Judicious choice of these materials will sometimes provide a better alignment to the analytical method in use than the references cited in the standard and thus better demonstrate “fitness for purpose”, providing a more straightforward and convenient route to achieving compliance.
References
- European Directorate for the Quality of Medicines & HealthCare (EDQM), “2.2.25 Absorption Spectrophotometry, Ultraviolet and Visible”, European Pharmacopoeia (Ph. Eur.) Edition 10.0, 42 (2020). https://www.edqm.eu/en/european_pharmacopoeia_10th_edition
- United States Pharmacopeia, “<857> ultraviolet-visible spectroscopy”, USP 42-NF37 Second Supplement (2S) (2019). https://www.uspnf.com/
- European Directorate for the Quality of Medicines & HealthCare (EDQM), “2.2.25 Absorption Spectrophotometry, Ultraviolet and Visible”, European Pharmacopoeia (Ph. Eur.) Edition 9.2 (2008).
- Starna Scientific Ltd Hainault Business Park, 52/54, Fowler Rd, Ilford IG6 3UT, UK. https://www.starna.com/reference-materials/uv-visible-spectroscopy
- Regulation (EC) No. 1907/2006 of The European Parliament and of the Council, 18 December 2006 on the Registration, Evaluation, Authorisation and Restriction of Chemicals (REACH) (2006).
- The use of Potassium Dichromate in the European Pharmacopoeia; Starna Position Paper. Technical Communication, June 2018
- International Organization for Standardization, “Linearity calibration using reference materials”, ISO 11095 (1996). https://www.iso.org/standard/1060.html
- C. Burgess, “Measurement uncertainty without the math”, Pharmaceut. Technol. Feb (2016).
- International Organization for Standardization, “Reference materials—selected terms and definitions”, ISO Guide 30:2015. https://www.iso.org/standard/46209.html
- International Organization for Standardization, “International vocabulary of metrology—basic and general concepts and associated terms (VIM)”, ISO/IEC Guide 99:2007. https://www.iso.org/standard/45324.html
- International Organization for Standardization, “General requirements for the competence of reference material producers”, ISO 17034 (2016). https://www.iso.org/standard/29357.html
- International Organization for Standardization, “General requirements for the competence of testing and calibration laboratories”, ISO/IEC 17025 (2017). https://www.iso.org/standard/66912.html


