Eleonora Imperio,a Gabriele Giancaneb and Ludovico Vallic,*
aDepartment of Innovation Engineering, Università del Salento, Via Monteroni, 73100 Lecce, Italy
bDepartment of Cultural Heritage, Università del Salento, Via D. Birago, 73100 Lecce, Italy
cDepartment of Biological and Environmental Science and Technologies, Università del Salento, Via Monteroni,
73100 Lecce, Italy. E-mail: [email protected]
Introduction
The evolution of the connections between Art and Science have been continually developing over the last few years. These links have led to many scientific characterisation and analysis techniques becoming increasingly applied to study works of art and artefacts. Today’s science and technology developments have led to many different approaches being used in the study of Cultural Heritage. New non-destructive methodologies allow one to apply physical and chemical analysis methods to valuable objects. Fourier transform infrared (FT-IR) spectroscopy has become a particularly useful technique in this field for the characterisation of material composition; in particular, the use of the attenuated total reflection (ATR) sampling technique allows one to analyse a wide range and type of valuable objects without causing any damage to the samples. Capable of seeing beyond the careful eye of the restorer or of the art historian, the FT-IR/ATR technique has been successfully employed in the material characterisation of many different samples coming from the world of art. The first systematic studies using spectroscopic investigations on stamps were performed using both the FT-IR and Raman spectroscopic techniques.1,2,3,4,5 The immediate and detailed response from this type of study has led to a large and very significant amount of data and information becoming available. Information which gives, not only an insight into the materials that compose a particular work of art, but also provide guidelines that supply further awareness important to conservative and restoration treatments. Discovering the ancient secrets of the artists and the real composition of art objects can be the key enlightening cases under study, which until that moment had been unresolved.
FT-IR spectroscopic characterisation of the components of Italian stamps
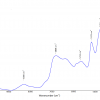
From the inscription of the General Post Office in Washington DC: “The stamp is the propagator of news, links between distant families, messenger between friends, solace in solitude, a vehicle for commerce and industry, an element of human progress, promoting brotherhood, peace, goodwill among men and nations”. It is hard to imagine how much history exists in a small piece of paper and how many purposes such a small object was destined to have. This is why postage stamps have become so important and of such interest that they have now begun to be actually considered as works of art. Over the 150 years of issues from the Unification of Italy until today, a timeline of the major components constituting the stamps has been defined, based on the wide spectral database built up on the basis of the numerous analysed examples. As a result of the mid-infrared spectra acquired in ATR mode, changes in paper composition show the transitions from different kinds of materials. Philately can be interpreted as perhaps an unconventional way to follow the historical, economic, political and custom evolution of a country and society. However, philately implies much more than mere stamp collecting, it concerns the whole and multifaceted study of stamps and postal history. Philately is a form of collecting that suffers from the same problems as other kinds of collections, such as conservation, restoration, counterfeiting and even understanding of materials and substances employed during the manufacturing procedure. Also stamps constitute a sort of artwork that can be very rare and precious. In our study, stamps were taken from a wide philatelic collection which included cancelled and pristine Italian exemplars starting from the Unification of Italy in 1861 until today. This wide period of time covered a lot of stamp issues and, from each one, items were chosen in order to characterise their constituents. More than 181 stamps have been studied.6 The samples were selected in order to inspect a specific type of stamp, relative to a particular year of production. Whenever any change in the paper composition was detected, further analyses on stamps backwards in time were undertaken in order to identify the first exemplar exhibiting the same variation. With this approach, it has been possible to identify the exact time of introduction of the technological and materials’ innovation. The analysis dealing with the first examples issued in 1862 shows the typical infrared absorbances associated with cellulose fibres at 1158 cm–1, 1106 cm–1, 1055 cm–1 and 1030 cm–1 attributed to the stretching vibrations of the C–O groups in glucose chains7 (Figure 1A).

The spectra of these cellulose-based paper samples also displayed the characteristic secondary amide bands at 1647 cm–1 (Amide I) and 1546 cm–1 (Amide II), attributable to protein glue sited between the fibres. From the analyses of other samples, it was found that this kind of sized paper was used in Italian stamps until 1929. In fact, the next samples issued on 21 April 1929 did not show evidence of protein glue, but instead a starch glue, which had therefore definitively replaced the former. The spectrum of the 75 cents red stamp of 1929 taken from the issue portraying a frontal image of Vittorio Emanuele III (Figure 1B) exhibits a characteristic C–O stretching signal of starch at around 1004 cm–1. Going forward in time, the use of kaolin was next introduced into the manufacturing of postage stamps. As an example, in Figure 1C it is evident in the spectrum of the sample dedicated to the Red Cross in 1915 with a denomination of 15 cents, where the kaolin bands are clearly evident as the three distinctive signals in the Si–OH stretching region at 3690 cm–1, 3648 cm–1 and 3617 cm–1.8 Furthermore, when kaolin is located as the top most coating layer, its absorption peaks tend to obscure any evidence of cellulose or glue absorption bands and two intense signals related to calcium carbonate at 1412 cm–1 and 870 cm–1 become evident. This is the case for most of the modern specimens, as apparent in the spectrum of a stamp issued in 2000 (Figure 1D). This component was added to the paper composition in 1896, as attested by the spectrum of the brown mail stamp issued on 1 July (denomination of 2 cents), which displayed the small but distinctive signal at about 3690 cm–1, due to the Si–OH stretching mode.
In addition to the front of a stamp sheet, the composition of the rear side has also been analysed. The first gum employed was protein glue, as indicated by the spectra of mail stamps of the first issue in 1862. Its infrared spectrum showed clearly the characteristic secondary amide bands at 1631 cm–1 and 1536 cm–1 (Figure 2A).

The first sample in the 1901 issue, exhibits signals ascribed to gum arabic (Figure 2B). In particular, the OH bending signal at about 1600 cm–1 with a shoulder at 1650 cm–1 and several signals in the spectral region between 1400 cm–1 and 1200 cm–1, associated with C–H bending vibrations and intense C–O peaks at 1020 cm–1 and 976 cm–1.9 The last change in rear side gum composition was brought in, in 1974, when polyvinyl acetate (PVAC) was introduced as the adhesive; from then on it has been the only one used (Figure 2C). The most intense band of this synthetic polymer is at 1730 cm–1 and it is attributed to C=O stretching in acetate groups. The other sharp peaks are related to C–H group bending modes at 1430 cm–1 and 1367 cm–1, and C–O stretching vibrations at 1227 cm–1, 1016 cm–1 and 940 cm–1, due to the presence of acetate monomer units. The signal at 1093 cm–1, instead, is related to the C–O stretching mode of vinyl alcohol units, thus confirming the beginning of the employment of the new synthetic polymer.10 PVAC was preferred to gum arabic because of its better response to oxidation and its greater photostability.
All these analysis have been summarised into a timeline which represents the modifications observed by the present investigations in stamp paper-making in Italy since 1862 until the present day (Scheme 1).

The usefulness of the proposed graphical timeline consists in being able to easily identify the type of material employed in the sample. It allows for determining if there is compatibility with the standard composition or not.
The identification of counterfeit stamps
During the last 20 years, the illegal trade in counterfeit postage stamps has grown all over the world and thousands of collectors have been deceived. This is another important reason why analysis has been conducted on these stamps. In particular, one of the most famous Italian stamps, the so-called “Gronchi Rosa” (Pink Gronchi), has been spectroscopically compared with a certified fake sample. This exemplar falls into the philatelic potential fake category, because of its rarity. The vast interest around this special sample began when it was withdrawn on 4 April 1961, only one day after it was issued. The subject is a geographic map and a plane created in order to celebrate the trip to South America of the Italian President Giovanni Gronchi. The stamp is part of a series in which every visited country is represented and shown in a darker colour. The Gronchi Rosa has the value of 205 Italian Lire and it refers to the journey to Peru. It was introduced on 3 April, but it was promptly observed that the boundaries of the foreign country were incorrect. Since then, many counterfeit stamps have been reproduced and a large number of fakes sold. A fake Gronchi Rosa sample (Figure 3C), attested by an approved philatelic expert, Dr Alfonso Ragosta, and belonging to a well-known set of faked stamps, was subjected to ATR/FT-IR spectroscopic analysis; its spectrum was subsequently compared with the one obtained from an original pristine specimen. Results have indicated a definite difference in contrast between the original and the fake sample composition. In the counterfeit stamp the coloured parts were not prepared with the addition of the kaolin extender. The fundamental difference between the two samples is the absence of kaolin signals in the fake stamp painting composition (Figure 3A).

The spectrum of the original genuine Gronchi Rosa shows the typical sharp peaks in the range 3600–3700 cm–1 related to hydroxyl group stretching modes, missing in the spectrum of the counterfeit. In addition, there is no evidence of the kaolin signals expected to be found at 1007 cm–1 and 912 cm–1. The distinctive more intense band of carbonyl stretching vibrations at 1730 cm–1 in the original exemplar, probably relating to oil compounds, demonstrate further dissimilarity in the medium composition of the painting mixture with the fake Gronchi, too (Figure 3B). Another class of falsified stamps is composed of original samples which have been altered in one or more components. Analysis on Italian stamps has led to a specimen which shows the presence of PVAC adhesive on the rear and on the front side. It would not be unusual if the sample was produced after 1974, since PVAC was used as gum from that time; but the investigated stamp was supposedly issued in 1865, 47 years before PVAC was first synthesised! The investigated sample is the 2-cent red stamp, the spectrum of which displays predominantly the presence of PVAC (Figure 3C). The occurrence of the PVAC on the front of the sample is likely due to a diffusion of the gum from the back side to the front face because probably an excess amount of glue was applied. This observation could represent a further confirmation of this being a falsified work.
Conclusion
More than 180 stamps have been studied, and each one has been analysed and categorised as being cancelled or pristine (uncancelled) and assigned as being an exemplar or otherwise, proceeding chronologically throughout Italian history. The large number of spectra recorded has allowed for the creation of an accurate database containing the peculiar spectral features of each specimen, collected for each component. This approach has led to a time mapping of the materials employed in 150 years of Italian postage stamp production. Every component of the paper used was characterised by means of FT-IR spectroscopy without causing any alteration to the specimens. This work has enabled a good knowledge to be obtained about any change made in the manufacture of stamps and contributed to building up a rich and detailed database, filled with all types of registered spectra. This research has also proven to be useful in the identification of counterfeit examples. This new approach constitutes a further scientific tool for the demonstration and confirmation of some samples as forged stamps, and the study has provided additional substantiation of the importance of performing new scientific approaches to the world of Cultural Heritage and of merging technological data with historical and classical information. The main innovation of the present research resides in: a) the proposal of a database covering, from a chronological point of view, the complete production of stamps of a modern country (more than 150 years, from 1861 onwards); and, b) the contemporaneous analysis over time of the materials constituting the postage stamps (fibres, fillers, glues, coatings and back glue adhesives). The advantage of our study resides in that it is a really simple, precise, immediate and non-destructive method of investigation that enables the easy realisation of a spectral library
Acknowledgements
The authors wish to thank “Studio Filatelico Salentino” in Lecce for the kind loan of the Gronchi Rosa fake exemplar.
References
1. M. Poslusny and K.E. Daugherty, ”Nondestructive adhesive analysis on stamps by Fourier transform infrared spectroscopy”, Appl. Spectrosc. 42, 1466 (1988). doi: http://dx.doi.org/10.1366/ 0003702884429814
2. J.H. Wang, “A versatile analytical method of identifying adhesive on stamps by specular-reflectance Fourier transform infrared spectroscopy”, Appl. Spectrosc. 44, 447 (1990) doi: http://dx.doi.org/10.1366/ 0003702904086317
3. T.D. Chaplin, R.J. Clark and D.R. Beech, “Comparison of genuine (1851–1852 AD) and forged or reproduction Hawaiian Missionary stamps using Raman microscopy”, J. Raman Spectrosc. 33, 424 (2002). doi: http://dx.doi.org/10.1002/jrs.874
4. T.D.Chaplin, A. Jurado-López, R.J. Clark and D.R. Beech, “Identification by Raman microscopy of pigments on early postage stamps: distinction between original 1847 and 1858–1862, forged and reproduction postage stamps of Mauritius”, J. Raman Spectrosc. 35, 600 (2004). doi: http://dx.doi.org/10.1002/jrs.1208
5. A. Vila, N. Ferrer and J.F. García, “Chemical composition of contemporary black printing inks based on infrared spectroscopy: Basic information for the characterization and discrimination of artistic prints”, Anal. Chim. Acta 591, 97 (2007). doi: http://dx.doi.org/10.1016/j.aca.2007.03.060
6. E. Imperio, G. Giancane and L. Valli, “Spectral database for postage stamps by means of FT-IR spectroscopy” Anal. Chem. 85, 7085 (2013). doi: http://dx.doi.org/10.1021/ac401067r
7. K. Pandey, “A study of chemical structure of soft and hardwood and wood polymers by FTIR spectroscopy”, J. Appl. Polym. Sci. 71, 1969 (1999). doi:http://dx.doi.org/10.1002/(SICI)1097-4628(19990321)71:123.0.CO;2-D
8. B.J. Saikia and G. Parthasarathy, “Fourier transform infrared spectroscopic characterization of Kaolinite from Assam and Meghalaya, Northeastern India” J. Mod. Phys. 1, 206 (2010). doi: http://dx.doi.org/10.4236/jmp.2010.14031
9. M.R.Derrick, D. Stulik and J.M.Landry, Infrared Spectroscopy in Conservation Science. Getty Publications, Los Angeles (1999).
10. D. Dibbern-Brunelli, T. Atvars, I. Joekes and V. Barbosa, “Mapping phases of poly(vinyl alcohol) and poly(vinyl acetate) blends by FTIR microspectroscopy and optical fluorescence microscopy”, J. Appl. Polym. Sci. 69, 645 (1998). doi: http://dx.doi.org/10.1002/(SICI)1097-4628(19980725)69:43.0.CO;2-


