Jamie Foss, Cole Strattman and Simonetta Tumbiolo
PerkinElmer, Inc.
DOI: https://doi.org/10.1255/sew.2022.a24
© 2022 The Authors
Published under a Creative Commons BY-NC-ND licence
Per- and polyfluoroalkyl substances (PFASs) represent a large group of thousands of anthropogenic compounds that have been produced and widely used in industrial applications and consumer products since the 1950s. Some of the major industry sectors using PFASs include aerospace and defence, automotive, aviation, food contact materials, textiles, leather and apparel, construction and household products, electronics, firefighting, food processing, and medical articles.
These compounds have unique physical and chemical characteristics: they all contain carbon–fluorine bonds (among the strongest chemical bonds in organic chemistry), that means they are highly stable and resistant to degradation. All PFASs are highly persistent in the environment. In fact, they are known to persist in the environment longer than any other man-made substance. This, along with their ubiquitous use, have led to the accumulation of PFAS in the environment, with growing concern of human exposure to these chemicals.1–3 Most PFASs are also easily transported in the environment covering long distances from the source of their release.
Many PFAS are found in human and animal blood and are present at low levels in a variety of food products and in the environment all over the globe. PFAS are found in soil and a number of water resources, including drinking, surface, ground- and wastewater.1–6
Among PFASs, perfluorooctanesulphonic acid (PFOS) and perfluorooctanoic acid (PFOA) have been the most prevalent in the environment and, having attracted the most attention, they have been included in many advisory guidelines. For example, the United States Environmental Protection Agency (US EPA) issued a health advisory of 70 parts per trillion (ppt, equivalent to 70 ng L–1) for PFOA and PFOS in drinking water.7
The European Chemicals Agency (ECHA) and the European Commission have, since 2014, screened data on PFASs contained in ECHA’s registration database and coordinated group-based regulatory work. The Drinking Water Directive, which took effect on 12 January 2021, includes a limit of 0.5 µg L–1 for all PFAS.8
The optimisation of analytical methods for identification and quantification of PFASs is essential for risk assessment. Because of its high sensitivity, selectivity and robustness, the most widely used analytical method for PFAS detection is based on Liquid Chromatography coupled with tandem Mass Spectrometry (LC/MS/MS). Many agencies have developed methods for the analysis of PFAS in environmental matrices. Among them:
US EPA Method 537.1 for the determination of 18 PFASs in drinking water. The LC/MS/MS method is based on isotopic internal standards with reversed-phase solid phase extraction (SPE) sample preparation.9
US EPA Method 8327, designed to measure a group of 24 PFAS compounds in ground, surface and wastewater samples, uses LC/MS/MS with external calibration.10
US EPA Method 533 addresses some shorter chain and more polar PFAS compounds. It contains a list of 25 PFAS compounds (C4–C12) comprising the majority of those in 537.1, with the addition of some polar fluorotelomers and ether carboxylic acids. The LC/MS/MS method uses isotopic dilution and ion exchange SPE sample preparation.11
US EPA Draft Method 1633 was introduced in 2021 and is for use in the Clean Water Act (CWA). It is a composite method for a broad range of PFAS in multiple matrices. The method encompasses 40 targeted PFAS compounds in various matrices, including aqueous, solids, biosolids and tissues.12
ISO 25101:2009 is utilised for the determination of PFOS and PFOA in unfiltered samples of drinking, ground- and surface water by coupling SPE with LC/MS/MS.13
For the determination of low levels of PFAS, it is necessary to utilise either a highly sensitive mass spectrometer, or a sample preparation technique that includes a concentration step. Coupling SPE with LC/MS/MS has been one of the most popular approaches to PFAS analysis in aqueous samples, and has been employed in EPA Method 537.1, as well as ISO 25101.
Sample preparation techniques differ according to the sample type. However, the key challenge of measuring ppt levels of PFAS is that these compounds are ubiquitous throughout the environment and accumulate everywhere, including the laboratory equipment and accessories. In fact, many of the components used in liquid chromatographs, mass spectrometers and SPE systems are made of polytetrafluoroethylene (PTFE) or PTFE copolymers, which leach PFAS compounds and cause background interference during a sample measurement. Even the use of glass sample containers can generate additional challenges, the glass in fact adsorbs PFAS compounds. Special care is required, and alternate materials must be used throughout the laboratory in order to reduce the absorption of these chemicals.
Reducing PFAS background
To reach accurate ultra-trace levels, every step of the analytical protocol must be free of PFAS materials, from sample collection to sample preparation, analysis and measurement. Table 1 summarises the necessary steps for reducing background contamination during sample preparation and analysis.
Table 1. Steps to reduce PFAS contamination.
Source of contamination | Mitigation |
Mobile phases | Purchase LC/MS grade solvents |
PFAS parts and tubing in HPLC pump | Use a delay column |
PFAS tubing in HPLC autosampler | Replace with PEEK tubing |
Vials and PTFE-lined caps | Use only polyethylene vials and caps |
PFAS tubing in SPE apparatus | Replace with polyethylene tubing |
Mobile phase and HPLC pump
High-quality mobile phases and blank runs are important aspects of the analysis. Additionally, instead of utilising conventional glass vials with PTFE-lined septa, polyethylene vials and caps are necessary to reduce the possibility of contamination. The HPLC pump, autosampler and SPE system all contain PFAS components that require mitigation as well.
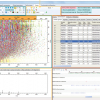
Customarily, the pump of an HPLC system has PTFE parts that can leach PFAS compounds. Moreover, contamination is likely in all but the highest grades of reagents. To combat interference from these sources, a delay column may be installed in the flow path between the pump and the autosampler, as shown in Figure 1.
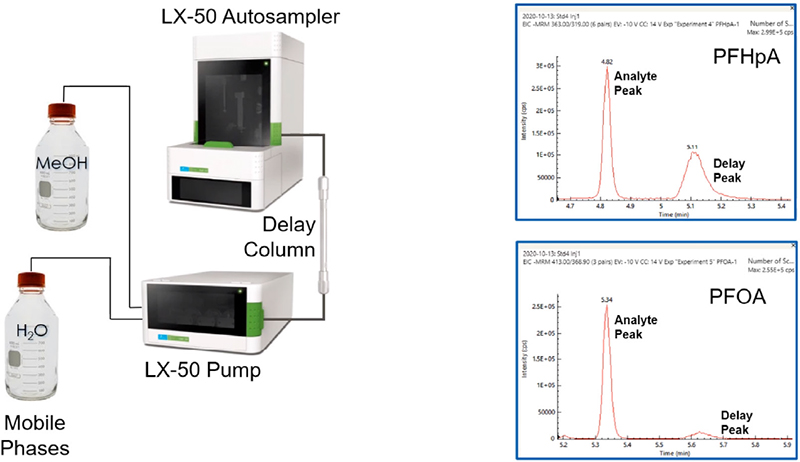
Figure 1. Reducing background from pump and mobile phases.
A delay column captures PFAS contaminants coming from the mobile phase, the solvent lines or the pump before they reach the autosampler. As a result, the captured compounds elute via the gradient later than the analyte peak in the sample.
The chromatograms to the right of the schematic show examples of the delay peak eluting after the analyte peak. Thus, installation of a delay column allows clear separation of PFAS contaminants from the analytes of interest, enabling more authentic measurements of PFAS in the sample.
Autosampler
In many cases, the HPLC autosampler contains fluoropolymer tubing which will introduce contamination upon injection of the sample. It is recommended to replace all tubing with high performance polyether ether-ketone (PEEK) to eliminate the possibility of PFAS contamination during sample injection. For convenience, PerkinElmer offers a kit specifically developed to replace the tubing in their autosamplers for PFAS applications.
Solid Phase Extraction (SPE) system
SPE extraction configurations normally include an abundance of fluoropolymers. The tubing connecting sample bottles to the SPE cartridges can be a significant source of PFAS contamination. Replacement of all transfer tubing with linear low-density polyethylene (LLDPE) or PEEK tubing is necessary to avoid PFAS leaching. In addition, some of the valving on the manifold may be constructed of PTFE; substitution with polyethylene stopcocks is recommended. Finally, sample collection during SPE extraction should employ polyethylene centrifuge tubes.
After proper mitigation of all possible PFAS sources, the LC/MS/MS system will be ready to analyse PFAS at low parts per trillion levels.
Example: Validation study using EPA 537.1
A recent study validated PerkinElmer’s PFAS mitigative steps by employing EPA Method 533 and EPA Method 537.1 on a QSight® 220 LC/MS/MS system (Figure 2). First, a 250 mL drinking water sample was collected in a polyethylene bottle. Next, the method involved fortification with surrogates to monitor the extraction efficiency. The sample was then concentrated by SPE using a polystyrenedivinylbenzene (SDVB) stationary phase. In this step, the sample was loaded onto the SPE tube and eluted with methanol. The extract was then evaporated to dryness under nitrogen and reconstituted in 1 mL of 96 % methanol. This concentrated the sample by a factor of 250, thereby enabling quantification of the low levels necessary for the analysis. Internal standards were added after reconstitution of the sample.
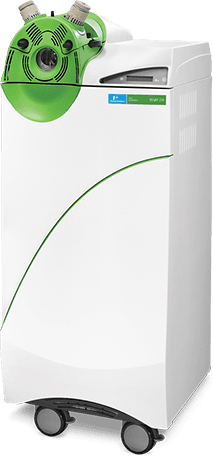
Figure 2. PerkinElmer QSight® 220 LC/MS/MS triple quadrupole system.
Subsequently, 10 μL of sample was injected onto a C18 column in the LC/MS/MS instrument. The analytes were separated in the LC column and eluted into the mass spectrometer, which was used in Multiple Reaction Monitoring (MRM) mode. The retention times for the calibration standards enabled identification of the compounds and the MRM transitions, for both quantifier and qualifier ions.
Separation
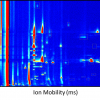
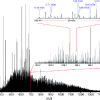
EPA Method 537.1 describes a chromatographic technique that takes approximately 37 minutes to separate the 18 analytes, surrogates and internal standards. However, improvements to the chromatographic method made by PerkinElmer scientists achieved a run time of about 10 minutes. This represented significant time savings while maintaining excellent chromatographic resolution, and excellent separation of the linear and branched isomers. Examples of their separation are shown in Figure 3.
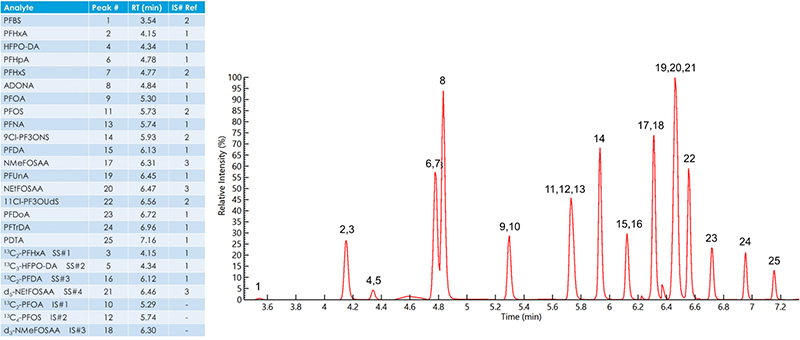
Figure 3. Total ion chromatogram of an 80 ng L–1 extracted fortified laboratory field blank sample containing all method analytes, surrogates and internal standards.
Calibration
Calibration curves were run for all 18 analytes and the surrogate standards, encompassing the range necessary to include the lower limits of detection (LOD) from EPA regulations. The full method ranged from 0.02 ppt to 120 ppt. As demonstrated in Table 2, excellent linearity was observed, with all correlation coefficient (R2) values for the calibration curves of 0.99 or better.
Table 2. Instrument and method calibration ranges and linearity (R2) for eight-point calibration curves of all EPA Method 537.1 analytes and surrogates.
Compound | Instrument calibration range (ng L–1)a | Method calibration range (ng L–1)b | R2 c |
PFBS | 16.4–26287 | 0.07–105.1 | 0.9994 |
PFHxA | 5.5–29703 | 0.02–118.8 | 0.9987 |
13C2-PFHxA | 4.6–24752 | 0.02–99.0 | 0.9989 |
13C3-HFPO-DA | 67.5–24752 | 0.27–99.0 | 0.9992 |
HFPO-DA | 18.5–29703 | 0.07–118.8 | 0.9985 |
PFHpA | 5.5–29703 | 0.02–118.8 | 0.9984 |
PFHxS | 5.2–28218 | 0.02–112.9 | 0.9998 |
ADONA | 5.2–28218 | 0.02–112.9 | 0.9990 |
PFOA | 5.5–29703 | 0.02–118.8 | 0.9998 |
PFOS | 5.3–28515 | 0.02–114.1 | 0.9974 |
PFNA | 18.5–29703 | 0.07–118.8 | 0.9993 |
9Cl-PF3ONS | 5.1–27772 | 0.02–111.1 | 0.9998 |
PFDA | 81.0–29703 | 0.32–118.8 | 0.9990 |
13C2-PFDA | 4.6–24752 | 0.02–99.0 | 0.9988 |
NMeFOSAA | 5.5–29703 | 0.02–118.8 | 0.9998 |
PFUnA | 18.5–29703 | 0.07–118.8 | 0.9968 |
NEtFOSAA | 5.5–29703 | 0.02–118.8 | 0.9968 |
d5-NEtFOSAA | 18.3–99010 | 0.07–396.0 | 0.9962 |
11Cl-PF3OUdS | 5.2–28069 | 0.02–112.3 | 0.9997 |
PFDoA | 18.5–29703 | 0.07–118.8 | 0.9963 |
PFTrDA | 5.5–29703 | 0.02–118.8 | 0.9959 |
PFTA | 5.5–29703 | 0.02–118.8 | 0.9967 |
aInstrument calibration range is the actual concentration range of calibration standards used to determine calibration curves.
bMethod calibration range is determined by multiplying the instrument calibration range by 1/250 to account for the SPE sample preparation/concentration.
cR2 values are the average of triplicate calibration curves.
Sensitivity
In terms of instrument sensitivity, the limits of quantitation (LOQ) and LOD were estimated based on signal-to-noise ratios. Data reported in Table 3 confirm that the QSight® 220 LC/MS/MS system is highly capable of performing the method successfully. With the 250-to-1 sample concentration from the SPE extraction step, the limits were well below the current requirements for all compounds, even those at extremely low levels.
Table 3. Instrument sensitivity (LOQ and LOD) for all target analytes in EPA Method 537.1.
Analyte | Instrument (ng L–1)a | Method (ng L–1)b | ||
LOD | LOQ | LOD | LOQ | |
PFBS | 2.00 | 6.68 | 0.008 | 0.027 |
PFHxA | 2.31 | 7.70 | 0.009 | 0.031 |
HFPO-DA | 6.70 | 22.35 | 0.027 | 0.089 |
PFHpA | 2.10 | 6.99 | 0.008 | 0.028 |
PFHxS | 0.38 | 1.28 | 0.002 | 0.005 |
ADONA | 0.24 | 0.79 | 0.001 | 0.003 |
PFOA | 2.57 | 8.56 | 0.010 | 0.034 |
PFOS | 0.92 | 3.07 | 0.004 | 0.012 |
PFNA | 2.52 | 8.40 | 0.010 | 0.034 |
9Cl-PF3ONS | 0.60 | 2.00 | 0.002 | 0.008 |
PFDA | 2.17 | 7.24 | 0.009 | 0.029 |
NMeFOSAA | 0.29 | 0.96 | 0.001 | 0.004 |
PFUnA | 3.50 | 11.67 | 0.014 | 0.047 |
NEtFOSAA | 0.25 | 0.85 | 0.001 | 0.003 |
11Cl-PF3OUdS | 0.44 | 1.48 | 0.002 | 0.006 |
PFDoA | 2.02 | 6.73 | 0.008 | 0.027 |
PFTrDA | 1.55 | 5.16 | 0.006 | 0.021 |
PFTA | 4.29 | 14.30 | 0.017 | 0.057 |
aInstrument LOD/LOQ was determined using the signal-to-noise ratio (S/N) of the peak from the lowest detectable calibration standard (5–18 ng L–1) and extrapolating to the concentration at which the S/N = 3 or 10 for LOD or LOQ, respectively. This is an estimate to demonstrate expected LOD/LOQ and can vary from lab to lab.
bMethod LOD/LOQ is calculated by multiplying the instrument LOD/LOQ by 1/250 to account for the 250 to 1 sample concentration from the SPE extraction. LOD/LOQ cannot be used as MRLs but provide an estimate of instrument sensitivity.
Experiments were conducted in order to define the method detection limits of all target analytes for EPA Method 537.1. The lowest concentration minimum reporting limits (LCMRLs) as well as the experimental minimum reporting limits (MRLs) were also determined. Results are tabulated in Table 4. Experimental MRLs are at acceptable levels to meet the current requirements for all the targeted PFAS compounds.
Table 4. Method detection limits (DL) and lowest concentration minimum reporting limits (LCMRL) and minimum reporting levels (MRL) determined experimentally on the QSight® LC/MS/MS system and compared to reference values report in EPA Method 537.1.
Analyte | Experimental | EPA 537.1 | Experimental | EPA 537.1 | Experimental |
PFBS | 1.1 | 6.3 | 0.72 | 1.8 | 1.4 |
PFHxA | 1.5 | 1.7 | 0.93 | 1.0 | 0.30 |
HFPO-DA | 1.5 | 4.3 | 0.57 | 1.9 | 1.6 |
PFHpA | 1.6 | 0.63 | 0.10 | 0.71 | 1.6 |
PFHxS | 1.2 | 2.4 | 0.60 | 1.4 | 0.29 |
ADONA | 1.4 | 0.55 | ND | 0.88 | 0.28 |
PFOA | 1.3 | 0.82 | 0.34 | 0.53 | 0.30 |
PFOS | 1.4 | 2.7 | 1.0 | 1.1 | 0.29 |
PFNA | 1.6 | 0.83 | 0.50 | 0.70 | 1.6 |
9Cl-PF3ONS | 1.1 | 1.8 | 0.68 | 1.4 | 1.5 |
PFDA | 1.1 | 3.3 | 0.40 | 1.6 | 0.30 |
NMeFOSAA | 1.2 | 4.3 | 0.22 | 2.4 | 0.30 |
PFUnA | 1.3 | 5.2 | 0.30 | 1.6 | 1.6 |
NEtFOSAA | 1.2 | 4.8 | 0.73 | 2.8 | 1.6 |
11Cl-PF3OUdS | 0.66 | 1.5 | 0.39 | 1.5 | 0.28 |
PFDoA | 1.2 | 1.3 | 0.19 | 1.2 | 0.30 |
PFTrDA | 1.0 | 0.53 | 0.82 | 0.72 | 4.0 |
PFTA | 0.86 | 1.2 | 1.5 | 1.1 | 4.0 |
aExperimental DL was determined from ten LFB replicates fortified at ~4.0 ng L–1 measured over three days and calculated according to section 9.2.8 in EPA Method 537.1 rev 2.0.
bReference DL values from EPA Method 537.1 rev 2.0 (Table 5) determined from seven LFB replicates fortified at 4.0 ng L–1 measured over three days and calculated according to section 9.2.8.
cExperimental LCMRLs were determined from ten replicates each at five fortification levels ranging from ~0.2 ng L–1 to 80 ng L–1 using the EPA LCMRL Calculator.11
dReference LCMRL values from EPA Method 537.1 rev 2.0 (Table 5).
eExperimental MRLs were determined from seven LFBs fortified at concentrations ranging from ~0.2 ng L–1 to 4.0 ng L–1 according to section 9.2.6 of EPA Method 537.1 rev 2.0 using the Half Range prediction interval method with confirmed upper and lower Prediction Interval Results (PIR) ≤150 % and ≥50 %, respectively.
Recovery
Recovery studies were completed for all 18 analytes by spiking fortified laboratory field blanks at four different levels, ranging from 0.3 ppt up to 80 ppt. Figure 4 shows the recoveries for each analyte at each of the four concentrations. EPA Method 537.1 requires recoveries between 70 % and 130 % of the known spiking level. The developed method using the QSight® 220 LC/MS/MS met requirements for recovery across all four concentrations evaluated.
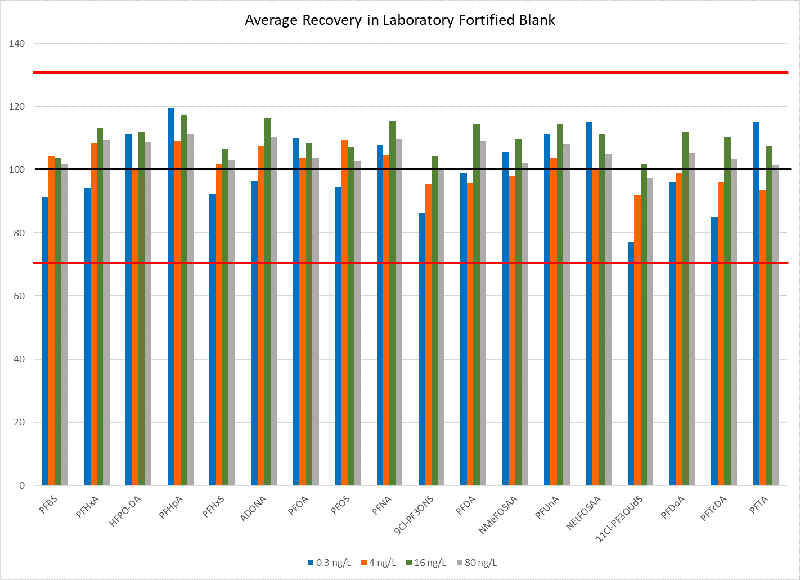
Figure 4. PFAS recovery precision and accuracy summary.
Conclusion
LC/MS/MS analysis of PFAS at ultra-trace levels requires mitigation to both liquid chromatograph and mass spectrometer to eliminate the leaching of fluorochemicals from components within the systems. Manual SPE configurations also require mitigative steps to eliminate any components constructed of PTFE to minimise or eliminate any PFAS contamination. PerkinElmer offers kits and knowhow to streamline remediation. The use of high-grade reagents and PFAS-free laboratory accessories are also critical. By implementing steps to remove or reduce background contamination and appropriate sample preparation, PerkinElmer’s highly sensitive QSight® 220 LC/MS/MS system has proven to be extremely capable of meeting the challenging demands of low-level PFAS analysis in drinking water. Validation studies demonstrated that the instrument easily meets stringent requirements of EPA 537.1 and 533 regulations for all targeted analytes.
References
- S.F.Nakayama, M. Yoshikane, Y. Onoda, Y. Nishihama, M. Iwai-Shimada, M. Takagi, Y. Kobayashi and T. Isobe, “Worldwide trends in tracing poly- and perfluoroalkyl substances (PFAS) in the environment”, Trends Anal. Chem. 121, 115410 (2019). https://doi.org/10.1016/j.trac.2019.02.011
- Agency for Toxic Substances and Disease Registry, Per- and Polyfluoroalkyl Substances (PFAS) and Your Health. Last review 6 July 2022 [accessed 30 August 2022]. https://www.atsdr.cdc.gov/pfas/index.html
- A.B. Lindstrom, M.J. Strynar and E.L. Libelo, “Polyfluorinated compounds: past, present, and future”, Environ. Sci. Technol. 45(19), 7954–7961 (2011). https://doi.org/10.1021/es2011622
- L. Ciofi, L. Renai, D. Rossini, C. Ancillotti, A. Falai, D. Fibbi, M. Bruzzoniti, J.J. Santana-Rodriguez, S. Orlandini and M. Del Bubba, “Applicability of the direct injection liquid chromatographic tandem mass spectrometric analytical approach to the sub-ng /L determination of perfluoro-alkyl acids in waste, surface, ground and drinking water samples”, Talanta 176, 412–421 (2018). https://doi.org/10.1016/j.talanta.2017.08.052
- M.M. Schultz, D.F. Barofsky and J.A. Field, “Quantitative determination of fluorinated alkyl substances by large-volume injection liquid chromatography tandem mass spectrometry characterization of municipal wastewaters”, Environ. Sci. Technol. 40(1), 289–295 (2006). https://doi.org/10.1021/es051381p
- H.A. Kaboré, S. Vo Duy, G. Munoz, L. Méité, M. Desrosiers, J. Liu, T. Karim Sory and S. Sauvéa, “Worldwide drinking water occurrence and levels of newly-identified perfluoroalkyl and polyfluoroalkyl substances”, Sci. Total Environ. 616–617, 1089–1100 (2018). https://doi.org/10.1016/j.scitotenv.2017.10.210
- US EPA, Drinking Water Health Advisories for PFOA and PFOS. Last review 12 July 2022 [accessed 30 August 2022]. https://www.epa.gov/sdwa/drinking-water-health-advisories-pfoa-and-pfos
- ECHA, Perfluoroalkyl Chemicals (PFAS). [accessed 30 August 2022]. https://echa.europa.eu/hot-topics/perfluoroalkyl-chemicals-pfas
- J. Shoemaker and D. Tettenhorst, Method 537.1: Determination of Selected Per- and Polyfluorinated Alkyl Substances in Drinking Water by Solid Phase Extraction and Liquid Chromatography/Tandem Mass Spectrometry (LC/MS/ MS). US Environmental Protection Agency, Office of Research and Development, National Center for Environmental Assessment, Washington, DC (2018).
- USA EPA Method 8327: Per-and Polyfluoroalkyl Substances (PFAS) Using External Standard Calibration and Multiple Reaction Monitoring (MRM) Liquid Chromatography/Tandem Mass Spectrometry (LC/MS/MS) [accessed 30 August 2022]. https://bit.ly/EPA8327
- USA EPA Method 533: Determination of Per- and Polyfluoroalkyl Substances in Drinking Water by Isotope Dilution Anion Exchange Solid Phase Extraction and Liquid Chromatography/Tandem Mass Spectrometry [accessed 30 August 2022]. https://www.epa.gov/sites/default/files/2019-12/documents/method-533-815b19020.pdf
- USA EPA Draft Method 1633: Analysis of Per- and Polyfluoroalkyl Substances (PFAS) in Aqueous, Solid, Biosolids, and Tissue Samples by LC-MS/MS [accessed 30 August 2022]. https://bit.ly/EPA1633
- ISO 25101:2009 Water Quality — Determination of Perfluorooctanesulfonate (PFOS) and Perfluorooctanoate (PFOA) — Method for Unfiltered Samples Using Solid Phase Extraction and Liquid Chromatography/Mass Spectrometry [accessed 30 August 2022]. https://www.iso.org/standard/42742.html

Jamie Foss
Jamie Foss is the Liquid Chromatography Product Manager for PerkinElmer. Prior to this role, he was a Sr. Application Scientist developing strategic applications in support PerkinElmer’s LC and LC-MS product portfolio. He has developed a wide variety of applications across food, environmental, industrial, forensics and cannabis. Prior to joining PerkinElmer in 2016, he spent four years as a forensic chemist for the State of Maine where he focused on the analysis of controlled substances and clandestine laboratory investigation.

Cole Strattman
Cole Strattman joined PerkinElmer in the role of Field Applications Scientist, supporting the Northeast US. Cole will be working with the Applied segments with a focus on the markets related to LC and LCMS instrumentation. Cole comes from a 14-year career at Rhodes Technologies where he was working as a scientist responsible for research and development. Cole has a Bachelor’s in Chemistry from University of RI and is experienced in method development & validation for GC, HPLC and LCMS using different instruments along with various sample preparation techniques.

Simonetta Tumbiolo
Dr Simonetta Tumbiolo has a background in environmental analytical chemistry, with particular focus on air and water pollution. She obtained her PhD in Chemistry in 2004 at the University of Nice, France and worked as researcher for almost a decade in different European institutes: Geneva University, Switzerland; Stockholm University, Sweden; and Turin University, Italy. In 2017, Simonetta joined the corporate world and enhanced her curriculum with a marketing training at Paris Business School. She has worked in PerkinElmer since 2021 as Solution Marketing Manager and market expert.
[email protected]