Carla Rodrigues,* Rodrigo Maia and Cristina Máguas
University of Lisbon, Faculty of Sciences, Centre for Environmental Biology, Stable Isotopes and Instrumental Analysis Facility (SIIAF), Ed. C2, Room 2.1.16, Campo Grande, 1749-016 Lisbon, Portugal. E-mail: [email protected]
Download Supplementary Material PDF: Full Text PDF (783.68 Kb
Introduction
Isotope ratio mass spectrometry (IRMS) is a technique which is finding increasingly widespread use in disciplines such as archaeology, medicine, geology, biology, food authenticity and forensic science. The number of publications per year containing the research topic “isotope ratio mass spectrometry” was in excess of 2050 up to 2006.1 The number of stable isotope ratio mass spectrometry (SIRMS) laboratories registered in 2012 at the ISOGEOCHEM list (http://list.uvm.edu/cgi-bin/wa?A0=ISOGEOCHEM) was approximately 150. A brief historical background on IRMS is shown in Table 1.
Table 1. IRMS historical background.2
Date | Description |
1919 | F.W. Aston, working in the Cavendish Laboratories, Cambridge, UK, shows that the m/z 22 observed by Thompson in 1912 is a minor isotope of Ne. |
1940 | Development of the Nier design suitable for routine measurements, which includes the 60º magnetic sector similar to those employed on modern gas isotope ratio mass spectrometers (GIRMS). |
1947 | Development of the dual-inlet system for the study of diffusion of H isotopes |
1950 | Development of a Nier-type mass spectrometer and its associated electronic units for the measurement of small differences in isotope abundance ratios |
The early methods for isotope analysis were time-consuming, with relatively low precision and accuracy. Work for improving accuracy was followed by attempts on simplifying the different analytical methods and reducing sample size. Today, IRMS is used for the analysis of a large range of both inorganic and organic materials.
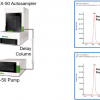
Samples may be examined as solids, liquids, or gases. The contents of a given sample have to be transformed into something that can be manipulated, separated and detected. The ability to analyse the contents of a given sample is facilitated if sample complexity is reduced through separation of the individual chemical components prior to their measurement. This principle has led to the extensive use of separation prep-systems hyphenated with mass spectrometers (as detectors), a combination which is frequently used for the conversion of “light” elements (C, N, O, S, H) present in samples in simple gas molecules for which stable isotope ratios can be determined. On-line systems with oxidising, reducing or pyrolysis reactors are combined in a continuous flow system, to transport reaction gases to the mass spectrometer. The stable isotope ratio mass spectrometer consists of an inlet system, an ion source, an analyser for ion separation and a detector for ion collection and quantification. The inlet system is designed to handle pure gases, principally CO2, N2, H2 and SO2. Neutral molecules from the inlet system are introduced into the ion source, where they are ionised by electron impact and accelerated to several kilovolts and then separated by a magnetic field and detected in Faraday cups.
In IRMS, it is possible to measure isotopic composition at low enrichment and natural abundance levels. This means that minute variations in very small amounts of the heavier (or less abundant) isotope are detected in the presence of large amounts of the lighter isotope. The very small variations in the heavier isotopes habitually measured by IRMS are expressed in the δ-notation (see box), units of permil, ‰ (one part in one thousand parts, with a value of 10–3). This unit is dimensionless and its associated value may be negative or positive.

Nowadays, the understanding of a wide set of processes responsible for the variations in isotope abundances in natural environments has improved, allowing one to know more on how environmental change is recorded. Researchers try to find materials such as carbonates, feathers, hard tissues, hair, tree-ring cellulose and the many chemical compounds that compose them, in order to trace and, therefore, record change.4 These studies can reveal the pace and magnitude of important ecological and environmental changes across a wide range of natural systems.5,6 The application of isotope analysis in this way will help mitigate future ecosystem damage and environmental degradation.
The subject of this article, plant seeds, has become an important object of study in the past decade, with the isotopic composition of certain bio-elements of seeds yielding relevant information on plant ecophysiology (for example, water use efficiency).5,7,8 In the later stages of maturation, seeds of many species acquire the capacity to withstand removal of the majority of their water (i.e. they become desiccation-tolerant). This characteristic allows for prolonged survival in a dry state and facilitates the sampling process of research studies in many different ecosystems throughout the world. Moreover, one of the key features of seeds, from both angiosperms and gymnosperms, is the propensity to accumulate reserves of nutrients, to fuel early seedling development or as a chemical defence against predators. These compounds, many of which result from secondary metabolism, open up a vast field of research opportunities, with many possible outcomes in fields ranging from ecology to food traceability. Seeds have therefore become important materials of study; however, one must bear in mind that they always refer to a specific “temporal window”, the seed developmental period which varies according to the plant species and its biology and depends on the climatic conditions where the plant is grown. Isotope analysis of chemical elements of plant seeds, or of specific organic compounds extracted from those seeds, may help to understand how different ecological processes influence plant development and physiology during the seed developmental period. Because this is intrinsically related to local climatic conditions (i.e. temperature, precipitation, air humidity), results generally potentiate the development of analytical tools towards traceability of the plant material.9,10 The objective of this article is to illustrate the main IRMS studies conducted on seeds and isotopes and outline the most important aspects of the use of seeds to study plant eco-geochemistry and plant material traceability.
Plant seeds
Wheat and barley
Agriculture, the origins of which can be traced to the early Holocene, has been fundamental in shaping the development of human society.11 Given its importance, the accurate estimate of crop yields in the past can shed light on a number of questions, such as those concerning food production and other aspects of the relationship between agriculture and natural resources usage. More specifically, it enables one to calculate the amount of agricultural land needed to satisfy given subsistence needs in specific populations, to infer the cultivation strategies of a particular period and to evaluate the environmental effects of the land use. However, all estimations of yields in the past are of limited validity given the uncertainties surrounding management techniques, the agronomical characteristics of genotypes and the particular environmental conditions in which these crops were grown.11 Faced with these difficulties, the analysis of the discrimination against the stable isotope 13C (Δ13C) [Δ13C = (Δ13Ca – δ13Cp)/[1 + (δ13Cp / 1000)], a refers to air and p to plant material.12] in crop grains collected from archaeological sites constitutes a simple and more direct method of estimating yields in ancient agriculture.11 For C3 species, δ13C in plant tissues constitutes an integrated record of the ratio of intercellular to atmospheric partial pressure of CO2 during the time the tissue was synthesised. For winter cereals cultivated under different environmental conditions, this ratio is mainly determined by variability in stomatal conductance and, hence, δ13C in grains is a valid indicator of water status during grain filling.13 Consequently, carbon isotope discrimination (Δ13C) should be related to yield in the C3 plant species.11,14 Wheat and barley have been the predominant crops in the Old World since agricultural practices were initiated in the Fertile Crescent.11,15 Their seeds have been collected from many archaeological sites, for example, in the Mediterranean region, where water availability is the main environmental factor determining differences in crop productivity. Once the relationship between Δ13C and yield in present-day crops has been established for a wide range of growing environments, it is possible to estimate the productivity of the crops in the past from the Δ13C values of grains collected at the archaeological sites. In order to find Δ13C for archaeological grains, the δ13C of atmosphere in the past is inferred from ice core data. However, these initial estimates must, subsequently, be corrected to take into consideration the main environmental and genetic differences between ancient and modern crops. Araus and co-workers11 have used Δ13C values of archaeological grains to estimate the yield of naked wheat (Triticum aestivum/durum) in an early agricultural settlement in the Fertile Crescent, in Syria. Naked wheat is a domesticated crop, irrespective of the archaeological context and time period in which its remains are found. Also, T. durum is the most widely cultivated wheat today. Thus, this allows for a comparison between the Δ13C values of ancient and present-day durum wheat grains. Araus and co-workers11 obtained a positive linear correlation between Δ13C and yield for present-day wheat and barley grains, cultivated under both rain-fed and irrigated conditions in Tell Halula, Syria. A positive correlation between Δ13C and water input during growth was also observed. Results indicated that the more water was available the higher the yield would be. Researchers estimated yields for ancient-day grains by applying the slope of the relationship between Δ13C and yield to the Δ13C of ancient grains with further correction to take into consideration harvest index and atmospheric CO2 levels of the past. The Δ13C values of the archaeological grains provided direct evidence that, during early agriculture, wheat crops cultivated at Tell Halula enjoyed a more favourable water regime than would be expected from present-day (rain-fed) conditions. In short, isotope analysis of crop seeds, for example, wheat and barley, may be an important tool to estimate crop yield (in both present and ancient days). Such studies have also shown that carbon isotope analysis of wheat and barley grains may be used as an indicator of plant water status as well as a method to evaluate water inputs in ancient agriculture.
Rice
Rice is the seed of the monocot plant Oryza sativa, from the grass family Poaceae. It is one of the most important foods for human population, especially in Asia and America, being the grain with the second highest worldwide production, after maize.16 The determination of rice authenticity is a complex issue because it depends on both geographical origin and cultivar type. However, the application of multi-element analysis, alone or in combination with stable isotope analysis, has been successfully applied for the discrimination between the same variety of rice grains from India/Pakistan, USA and Europe samples17 and Japanese samples.18 Kelly and co-workers17 documented that long-grain rice from USA, Europe, India and Pakistan could be distinguished by boron and magnesium content and by oxygen isotopic composition.
Other workers18 compared Koshihikari rice samples from 12 different Japanese rice producing regions. In Japan, packed polished rice requires labels indicating cultivar, cultivation area and year of production, in accordance with the Japanese Agricultural Standard (JAS) law. Rice δ13C, δ15N and δ18O were determined by an elemental analyser/IRMS (EA/IRMS). Additional rice samples from Australia (New South Wales) and USA (California) were also analysed. The results of this work showed that Californian rice had a higher δ18O value (+22.9‰) compared to the other samples and was clearly distinguishable from the New South Wales (Australia) (+20.3‰) and Japanese rice samples (+18.8‰ to +20.7‰). As often observed with other plant organic materials, rice δ18O values reflected well the oxygen isotopic composition of local precipitation for the rice cultivation period. In addition, New South Wales rice showed a higher δ15N value (+9‰) than other rice samples and was clearly discriminated from both Californian (+3.2‰) and Japanese rice samples (+0.4‰ to +6.1‰). Nitrogen isotopic composition of rice is thought to depend mainly on soil fertilisation practices, where the rice is cultivated. Generally, organic fertilisers increase 15N content in soil and plants, whereas the utilisation of artificial fertilisers decreases it.19 In fact, in Australia, many farmers rotate rice crops with pasture crops over several years. Thus, the agricultural cycle in Australia may be consistent with the high δ15N value of the Australian rice determined in this study. The results of this study suggest that rice from New South Wales (Australia) and California (USA) may be distinguished from Japanese rice samples by high δ15N or high δ18O values. Also, results for the 12 different Japanese rice samples indicated small differences between growth environments within Japan. However, this aspect of the work needs further research to confirm these differences.
Coffee
Many coffees from different geographical origins and of different types and grades are imported yearly by coffee roasting companies through a commercial chain that usually involves several intermediates. To ensure that coffees are not adulterated, it is important to develop analytical tools for coffee bean geographical origin discrimination. The isotopic fingerprint of the coffee bean should be a result of plant variety, cultivation practices, processing and, most important, of the relationship between plant and local environment. In this sense, variations in isotopic composition of coffee beans from different geographical origins, with their own climate and geology, should be expected. Serra and co-workers20 determined the isotopic composition of carbon, nitrogen and boron in green coffees from 19 different countries, showing that the isotopic composition of these three elements is a good indicator of geographical-dependent parameters and, therefore, a useful tool to infer the region of production of green coffee. However, the study of the relationships between isotopes of the coffee bean and environmental factors is still relatively recent.8,21 In a study developed on a global scale, researchers measured isotope ratios of carbon, nitrogen, oxygen and strontium in green coffee beans and have searched for relationships between the isotope ratios and available information on environmental factors.7,21 Such studies are important in order to understand how this seed (i.e. the coffee bean) integrates isotope fractionations occurring during its development, associated to changes in local climate and to geology. This may ultimately lead to discrimination between coffee producing regions. Green coffee beans from more than 20 different geographical origins were characterised in their respects to C, N and O isotopic composition and to C and N percentages.21 The mean and standard deviation values of δ13C, δ15N and δ18O and of C and N percentages obtained for green coffees from different continents is shown in Table 2.
Table 2. Mean, standard deviation and range of values of δ13C, δ15N and δ18O of green coffee beans from the American, African and Asian continents.12
Continent | δ13C/‰ | δ15N/‰ | δ18O/‰ | ||||||
Mean | Std dev. | Range | Mean | Std dev. | Range | Mean | Std dev. | Range | |
America | –27.4 | 1.5 | –22.1 to –31.4 | 2.7 | 1.3 | 0.2 to 5.8 | 27.2 | 2.9 | 18.7 to 33.2 |
Africa | –27.1 | 1.4 | –24.5 to –29.9 | 3.5 | 1.5 | –0.4 to 6.5 | 30.4 | 3 | 23.9 to 39.8 |
Asia | –28 | 0.9 | –25.4 to –29.5 | 2.7 | 1.1 | 0.4 to 5.7 | 24.3 | 2.5 | 18.3 to 29.4 |
All groups | –27.4 | 1.4 | –22.1 to –31.4 | 2.9 | 1.4 | –0.4 to 6.5 | 27.7 | 3.5 | 18.3 to 39.8 |
The δ13C mean value for all groups was –27.4 ± 1.4‰ (see Table 2); this is in close agreement with an approximate value of 26‰ reported by others22 for δ13C in plant tissues. However, this more recent study showed that the coffee bean δ13C values varied depending on the geographical origin with values ranging from –31.4‰ up to –22.1‰ (Table 2). As already mentioned, factors changing stomatal conductance and/or photosynthetic capacity (for example, water deficit, light, vapour pressure deficit), thus changing the ratio of CO2 partial pressure in the leaf interior sub-stomatal cavities and air surrounding the leaf, will change the values of δ13C found for plant tissues. Based on this, the variations observed among δ13C values of coffee beans were interpreted as reflecting differences in water availability, precipitation amount, temperature and air relative humidity (RH) between the different geographical origins. The observed 10‰ variation in coffee bean δ13C should be related to the occurrence of factors influencing stomatal conductance during the coffee bean developmental period. However, a lack of knowledge on how these factors interacted with coffee plants at each location made understanding of the data obtained difficult. Further ecophysiology studies under field conditions are necessary in order to gain understanding on the processes that determine carbon fractionation in the coffee plant, fruit and seed.
For N, the range of coffee bean δ15N values observed was –0.4‰ to 6.5‰, with a global average of +2.9‰ ± 1.4‰ (Table 2). The observed range of δ15N values suggests that differences in coffee plants’ N metabolism, eventually associated with different agricultural practices, may be important. In the case of oxygen, green coffee bean δ18O values varied from +18.3‰ to +39.8‰, with a mean value for all groups studied of +27.7‰ ± 3.5‰ (Table 2). The mean value was close to those reported by Yakir and co-workers23 for cellulose δ18O in leaves (27‰). Less is known about oxygen fractionation in seeds (i.e. the coffee bean) than in other plant organs such as leaves and stems. However, several workers have shown that oxygen isotope composition of plant organic material is known to reflect that of source water and leaf evaporative conditions at the time the material was formed.24 In this sense, coffee bean δ18O values (δ18Obean) should reflect local precipitation δ18O (δ18Oprec). Although δ18O values of precipitation from the regions studied would sometimes overlap, usually more depleted values were observed in Asia in comparison to America and Africa. This may be related to the variations observed in coffee δ18Obean values, the differences of which allowed for coffee differentiation at continental level.21 Studies such as these indicate that oxygen is an important element for green coffee bean geographical origin differentiation. Figure 1 shows the range of δ18Obean values for coffee beans from the African, American and Asian continents.
, Africa (n = 63) and Asia (n = 34) (legend: small rectangle, mean; large rectangle, mean ± SE; bar, mean ± SD).21")
The data set generated allowed for the evaluation of the relationships between the coffee bean isotopic composition and environmental factors. By knowing the geographical coordinates corresponding to each coffee sample, it was possible to access different databases and gather information on climate parameters. For example, in the American continent, correlations between the δ18Obean and the δ18Oprec (r = 0.74) and between altitude and δ18Obean(r = –0.66) were observed.7 Rain at higher altitudes (characterised by lower temperatures) becomes more depleted in 18O, consequently having lower δ18O.25 This was reflected in the δ18Obean of altitude coffees.
A subsequent study was developed within a smaller coffee-producing region, Hawaii.8 Researchers reported that the isotopic composition of Hawaiian green coffee beans varied according to several environmental factors, such as the altitude at which the coffee was produced, the isotopic composition of local precipitation and influences from the ocean, anthropogenic emissions and volcanic activity. In this particular case, the influence of volcanic activity, tropical storms, distance to the coast and altitude were inferred from the isotope ratios measured in the coffee beans. These observations were supported by significant correlations between the green coffee bean isotopic composition and the various environmental factors. For each coffee, known values of latitude, longitude and of altitude allowed for the calculation of the corresponding values of δ18O of local precipitation with the OIPC (The Online Isotopes in Precipitation Calculator).25 It was thus possible to obtain a correlation between the δ18O of coffee beans and of precipitation (r = 0.56; p < 0.05).
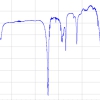
Figure 2 shows the variation of δ34O and of δ34S values in the different Hawaiian coffee bean samples in relation to altitude. The higher values were observed at altitudes under 200 m, where coffee is produced closer to the ocean (at lower altitude values).8 Atmospheric deposition is an important sulfur source in the Hawaiian coastal region, but its contribution decreases with increasing distance from the sea.26 Monitoring atmospheric, volcanic ash, soil and precipitation sulfate isotopes will be important in order to understand how sulfur isotopes of coffee beans reflect these important environmental impacts. In addition, further research on S-isotopes fractionation processes during coffee seed development is necessary to evaluate the differences in S-assimilation and isotope fractionation.
 δ18O and (b) δ34S of green coffee beans in relation to altitude.8")
The study suggested that the isotopic composition of coffees from different regions could, to some degree, be predictable. If so, this would support the use of stable isotopes as a tool for the verification of coffee origin. In addition, the coffee plant seeds’ isotopes may contribute to tracing environmental impacts occurring in Hawaii, in particular if related to volcanic activity, distance to the ocean, anthropogenic emissions and altitude.
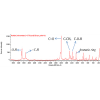
Moreover, as the coffee bean is a complex matrix, mainly constituted of cellulose, but rich in other carbohydrates, lipids and products of secondary metabolism, several researchers have tried to achieve geographical origin discrimination based on stable isotope analysis of specific compounds extracted from the bean (for example, caffeine).27 The pattern of caffeine synthesis during fruit development in Coffea arabica and Coffea canephora is similar, although the caffeine content in these two species is 0.6–1.5 and 2.2–2.7, respectively.28 In ripened coffee seeds, accumulated caffeine appears to be synthesised within the developing seeds. Once the plant seed is totally formed, this chemical defence is no longer needed; its biosynthesis stops, the fruits loose chlorophyll and accumulate anthocyanins and sugars, resulting in the characteristic coffee cherry-like fruit. The origin of the oxygen atoms in the caffeine molecule has already been described.29 The biosynthetic pathway leading from primary metabolism to caffeine involves three methylation reactions and a de-ribosylation, which does not involve the oxygen atoms of the xanthosine purine nucleus of caffeine precursors. For this reason, a correlation between δ18O value of caffeine to the leaf water sensitive to the individual conditions of plant cultivation and climate is expected. This explains how caffeine’s geographical origin was discriminated through oxygen and hydrogen isotope ratio analysis.27 This research indicated the relevance of isotope analysis of specific compounds extracted from the plant bulk material, in this case the green coffee bean, for geographical origin differentiation and for ecology studies.
Conclusions
The several case-studies described here reflect the importance of combining isotope ratio mass spectrometry and plant seed analysis as a “tool” to study change in plant ecophysiology over time and space. In order to apply this analytical approach, it is important to know the geographical area where plants have been grown. As a first step, as extensive as possible characterisation with reference to both the climatic and geological points of view needs be undertaken. Also, information on cultivation methods and processing and species and varieties/cultivars, should be considered, in order to build the most extensive and useful database. Next, a series of analyses encompassing a set of chemical elements may be selected and tested to achieve the best results with IRMS analyses. The fact that, for a large number of samples, information on exact geographical location and related environmental factors can be accessed, allows the correlation between experimental results and data available on, for example, altitude, latitude, δ18O of precipitation. In this context, isotope analysis of plant seeds may be an important tool for different studies in fields such as paleoclimatology, paleoecology, plant ecophysiology and agronomy, as well as of traceability. It allows for approaching different ecosystem specificities, enclosing different spatial and temporal scale, as isotopes of plant seeds record a series of important ecological processes. Their study will give an important contribution to the understanding on how environmental, biological and geological change occurs. When applied over a multi-year period of study (i.e. different years, even decades and millennia) isotope delta values can give us a completely different perspective of nature cycles and plant physiological responses to the ever changing environment.
Further reading
More background information and references may be found in the on-line Further Reading section at: http://tinyurl.com/RodriguesSupp.
Acknowledgements
The authors wish to thank the Portuguese Science Foundation through the project ISOGEOCOFFEE (Pursuing Green Coffee Geographic Origin Discrimination through Relations between Isotopes and Environmental Factors) (PTDC/AGR-AAM/104357/2008). Carla Rodrigues wishes to thank the Portuguese Science Foundation for a grant on the scope of this project.
References
- Z. Muccio and G.P. Jackson, “Isotope ratio mass spectrometry”, Analyst 134, 213 (2009). doi 10.1039/b808232d
- J.T. Brenna, “High-precision gas isotope ratio mass spectrometry: recent advances in instrumentation and biomedical applications”, Acc. Chem. Res. 27, 340 (1994). doi: 10.1021/ar00047a004
- T.B. Coplen, “Guidelines and recommended terms for expression of stable-isotope-ratio and gas-ratio measurements results”, Rapid Commun. Mass Spectrom. 25, 2538 (2011). doi: 10.1002/rcm.5129
- T.E. Dawson and R.T.W. Siegwolf, “Using stable isotopes as indicators, tracers, and recorders of ecological change: some context and background”, in Stable Isotopes as Indicators of Ecological Change, Ed by T.E. Dawson and R.T.W. Siegwolf. Elsevier, Burlington, Massachusetts, USA (2007).
- M. Aguilera, J.P. Ferrio, J.L. Araus, J. Tarrús and J. Voltas, “Climate at the onset of western Mediterranean agriculture expansion: Evidence from stable isotopes of sub-fossil oak rings in Spain”, Palaeogeogr. Palaeocl. 299, 541 (2011). doi: 10.1016/j.palaeo.2010.11.026
- G.J. Bowen, J.B. West and J. Hoogewerff, “Isoscapes: Isotope mapping and its applications”, J. Geochem. Explor. 102, v (2009). doi: 10.1016/j.gexplo.2009.05.001
- C. Rodrigues, C. Máguas and T. Prohaska, “Strontium and oxygen isotope fingerprinting of green coffee beans and its potential to proof authenticity of coffee”, Eur. Food Res. Technol. 232, 361 (2011). doi: 10.1007/s00217-010-1362-z
- C. Rodrigues, M. Brunner, S. Steiman, G. Bowen, J.M.F. Nogueira, L. Gautz, T. Prohaska and C. Máguas, “Isotopes as tracers of the Hawaiian coffee-producing regions”, J. Agric. Food Chem. 59, 10239 (2011). doi: 10.1021/jf200788p
- S. Kelly, K. Heaton and J. Hoogewerff, “Tracing the geographical origin of food: The application of multi-element and multi-isotope”, Trends Food Sci. Technol. 16, 555 (2005). doi: 10.1016/j.tifs.2005.08.008
- A. Gonzalvez, S. Armenta and M. de la Guardia, “Trace-element composition and stable-isotope ratio discrimination of foods with Protected Designation of Origin. Trends Anal. Chem. 28, 1295 (2009). doi: 10.1016/j.trac.2009.08.001
- J.L. Araus and G.A. Slafer, “FOCUS: Estimated wheat yields during the emergence of agriculture based on the carbon isotope discrimination of grains: evidence from a 10th Millenium BP site on the Euphrates”, J. Archaeological Sci. 28, 341 (2001). doi: 10.1006/jasc.2000.0569
- G.D. Farquhar, J.R. Ehleringer and K.T. Hubik, “Carbon isotope discrimination and photosynthesis”, Ann. Rev. Plant Physiol. Plant Mol. Biol. 40, 503 (1989). doi: 10.1146/annurev.pp.40.060189.002443
- J.L. Araus, D. Villegas, N. Aparicio, L.F. García-del-Moral, S. Elhani, Y. Rharrabti, J.P. Ferrio and C. Royo, “Environmental factors determining carbon isotope discrimination and yield in durum wheat under Mediterranean conditions”, Crop Sci. 47, 170 (2003). doi: 10.2135/cropsci2003.0170
- L. Cabrera-Bosquet, R. Albrizio, J.L. Araus and S. Nogués, “Photosynthetic capacity of field-grown durum wheat under different N availabilities: A comparative study from leaf to canopy”, Environ. Geosci. 67, 145 (2009).
- D.R. Harris, “The origins of agriculture in southwest Asia”, in The Transition to Agriculture in The Old World, Ed by O. Bar-Yosef, The Review of Archaeology 19, 5 (1998).
- A. González, S. Armenta and M. de la Guardia, “Geographical traceability of “Arròz de Valencia” rice grain based on mineral element composition”, Food Chem. 126, 1254 (2011). doi: 10.1016/j.foodchem.2010.11.032
- S. Kelly, M. Baxter, S. Chapman, C. Rhodes, J. Dennis and P. Brereton, “The applications of isotopic and elemental analysis to determine the geographical origin of premium long grain rice”, Eur. Food Res. Technol. 214, 72 (2002). doi: 10.1007/s002170100400
- Y. Suzuki, Y. Chikaraishi, N.O. Ogawa, N. Ohkoushi and T. Korenaga, “Geographical origin of polished rice based on multiple element and stable isotope analysis”, Food Chem. 109, 470 (2008). doi:10.1016/j.foodchem.2007.12.063
- R. Evans, “Physiological mechanisms influencing plant nitrogen isotope composition” Trends Plant Sci. 6, 121 (2001). doi: 10.1016/S1360-1385(01)01889-1
- F. Serra, C. Guillou, F. Reniero, L. Ballarin, M. Cantagallo, M. Wieser, S. Iyer, K. Héberger and F. Vanhaecke, “Determination of the geographical origin of green coffee by principal component analysis of carbon, nitrogen and boron stable isotope ratios”, Rapid Commun. Mass Spectrom. 19, 2111 (2005). doi: 10.1002/rcm.2034
- C. Rodrigues, R. Maia, M. Miranda, M. Ribeirinho, J.M.F. Nogueira and C. Máguas, “Stable isotope analysis for green coffee bean: a possible method for geographic origin discrimination”, J. Food Comp. Anal. 22, 463 (2009). doi: 10.1016/j.jfca.2008.06.010
- D. Yakir and L. d. S.L. Sternberg, “The use of stable isotopes to study ecosystem gas exchange”, Oecologia 123, 297 (2000). doi: 10.1007/s004420051016
- D. Yakir and M.J. DeNiro, “Oxygen and hydrogen isotope fractionation during cellulose metabolism in Lemna gibba L”, Plant Physiol. 93, 325 (1990). doi: 10.1104/pp.93.1.325
- M.M. Barbour, “Stable oxygen isotope composition of plant tissue: a review”, Funct. Plant Biol. 34, 83 (2007). doi: 10.1071/FP06228
- G.J. Bowen and J. Revenaugh, “Interpolating the isotopic composition of modern meteoric precipitation”, Water Resour. Res. 39, 1299 (2003). doi: 10.1029/2003WR002086
- N.V. Hue, R.L. Fox and J.D. Wolt, “Sulfur status of volcanic ash-derived soils in Hawaii”, Commun. Soil Sci. Plant Anal. 21, 299 (1990). doi: 10.1080/00103629009368232
- B. Weckerle, E. Richling, S. Heinrich and P. Schreier, “Origin assessment of green coffee (Coffea arabica) by multi-element stable isotope analysis of caffeine”, Anal. Bioanal. Chem. 374, 886 (2002). doi: 10.1007/s00216-002-1560-z
- H. Ashihara, H. Sano and A. Crozier, “Caffeine and related purine alkaloids: Biosynthesis, catabolism, function and genetic engineering”, Phytochemistry 69, 841 (2008). doi: 10.1016/j.phytochem.2007.10.029
- O. Schmidt, J.M. Quilter, B. Bahar, A.P. Moloney, C.M. Scrimgeour, I.S. Begley and F.J. Monahan, “Inferring the origin and dietary history of beef from C, N and S stable isotope ratio analysis”, Food Chem. 91, 545 (2005). doi: 10.1016/j.foodchem.2004.08.036