Christopher Burgess and John Hammond
Burgess Analytical Consultancy Limited, ‘Rose Rae’, The Lendings, Startforth, Barnard Castle, Co. Durham, DL 12 9AB, UK
Starna Scientific Ltd, 52–54 Fowler Road, Hainault Business Park, Hainault, Essex, IG6 3UT, UK
Continuing the series of articles on spectroscopy, we return principally to the UV-visible area of the spectrum, but this time to the science of luminescence (fluorescence and phosphorimetry), in all its many forms. Given the diversity of the application areas and instrument types available, in such an article we can only briefly give an overview of the topic and interested parties are, therefore, recommended to follow-up the listed references for more in-depth discussion on the points raised.
Luminescence measurements are no different with respect to the necessary data quality than those spectroscopic measurements previously discussed. However, as we shall see, its fundamental principles and the instrumental factors involved, are somewhat more complicated than in absorption measurements and often forgotten or overlooked. More seriously, they may not even be considered when reviewing a spectrum or the number obtained from an assay. The accessible literature is more scattered and less well documented than for absorption or emission spectroscopies. This is rather strange, as luminescence measurements are at least as old as absorption ones.1 Unfortunately, the standard work on standards and measurement techniques in fluorescence has been out of print for many years.2 In addition, the classic analytical chemistry texts, for example Hercules,3 have not been updated.
Principally, for these reasons and at the request of the ASTM International membership, a new standard practice for using and qualifying fluorescence spectrometers has been issued by ASTM4 and IUPAC are working on a series of similar informative documents.
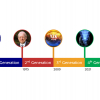
Also, at long last, some of the National Metrology Institutes (NMIs) are responding to the request to provide primary certified reference materials for fluorescence measurements. BAM (Germany) have produced a series of visible dyestuffs with defined characteristics that are commercially available and NIST (USA) is adding, in addition to the availability of SRM 936a Quinine Sulphate, a series of metallic-doped glasses as Relative Intensity Correction Standards. Four of these glasses are available as SRM 2940, 2941, 2942 and 2943, covering the orange, green, UV and blue areas of the spectrum, respectively. Having these materials available, is allowing secondary producers to produce traceable references, for example, quinine sulphate, hi-purity “Raman” water etc. in sealed-cuvette format.
Once again, many of these changes have been as the result of demand in specific areas and as a requirement to find solutions to defined problems.
Instrument design
In 1959, SAFAS introduced the world’s first spectrofluorometer with grating monochromators and, during the 1960s and 1970s, many of the instrument manufacturers offering products today introduced their first fluorescence instruments. As the first commercially-available scanning spectrofluorometer, the original AMINCO–Bowman triggered a revolution in fluorescence instrumentation in the 1950s. Working with others at NHI, Dr Bowman developed the first prototype of his spectrophotofluorometer in 1955. Unlike previous fluorometers, this new instrument was able to vary the wavelength of exciting light as well as measure the intensity and wavelength of the emitted fluorescent light. This instrument could be used to survey biological compounds and help scientists figure out new ways to use fluorescence to study the body. Because of exciting results with the prototype, the American Instrument Company (AMINCO) of nearby Silver Spring, Maryland, USA, became interested in marketing the new instrument. The first AMINCO–Bowman SPF was exhibited at the 1956 Pittsburgh Analytical Instrument Conference, and the AMINCO–Bowmen name continued into this century as the AB2.
Sadly, like so many, the name has passed into history and the expertise along with it.

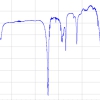
For the record, the optical diagram of this revolutionary spectrometer is shown in Figure 1. Apart from the obvious changes in electronics, this optical design principle is still in use today. Subsequently, the technique entered a “quiet phase”, where the use of fluorescence was basically held back by a number of constraints, which required the development of essential components. Prior to 1985, most DNA sequencing was performed using radioactive labels; however, the development of fluorescence probes with longer excitation and emission wavelengths and the ability to be introduced into cells, with spontaneous folding and formation of the fully fluorescent protein, revolutionised the science and “kick-started” the revival. Couple this with the availability of ultra-fast lasers and appropriate computing power and you see why the technique is experiencing a renaissance.
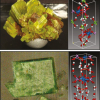
One new development area also encompasses the ever-expanding field of nanotechnology. As shown in the picture below, quantum dots can be manufactured and made to fluoresce across the whole spectrum. The unique property of these systems is that, whilst the excitation wavelength remains constant, the emitted “colour” is produced by simply changing the size of dot. This “tuneability” allows for the easy development of multi-colour assays.

The magnitude of this growth can be seen in the fact that, since 2004, a leading scientific publishing house has actually produced an Annual Fluorescence Review series of current work, although the “2008” volume is yet to be released.
As much of the physics associated with instrument design is the same as that required for absorptiometric UV/Visible/NIR spectrometry, we have seen the technique broaden into similar areas using simple filter-based instruments, micro-plate array readers, fibre-optics, microscopes and even fluorescence versions of the ultra-low sample volume devices—but the question of qualification still remains.
Instrumental qualification
As discussed previously, the science of absorption spectroscopy and the qualification of the instrumentation used is relatively simple and well documented, albeit that the availability of reference materials in some areas is limited and the procedure may be somewhat time-consuming and laborious. However, at the end of the process, if performed correctly, spectral information, methodology etc. can be compared and transferred from one environment to another.
Currently, the same cannot be said for its emission “cousin”—why, because as Lakowicz5 states simply “…In contrast to absorption measurements, fluorescence intensity measurements are absolute, not relative”. In simple terms, the fundamental ratio absorption measurement cancels out the non-ideal behaviour of sources, detectors etc. However, and unfortunately, the same cannot be said for the generation of emission spectra (relative photon intensity vs wavelength), even though they appear similar on “paper”.
Therefore, to obtain a true “corrected” emission spectrum, an ideal spectrofluorometer would contain:
- a light source which yields a constant photon output at all wavelengths;
- a monochromator which passes photons of all wavelengths with equal efficiency;
- a monochromator whose efficiency is unaffected by polarisation;
- a detector whose response function is independent of wavelength;
none of which are physically possible.
Therefore, in reality, the process of qualification of a spectrofluorometer requires the establishment of the actual response functions of the source and detector and associated factors, for example, linearity, either directly or indirectly, and then applying the appropriate corrections. In addition, the instrument is still fundamentally a spectrometer, so the parameters of wavelength accuracy and spectral slit width have to be qualified and, on a day-to-day basis, the wavelength and intensity scales verified.
Once you have qualified your instrument, there are still a range of method-specific parameters which you may/may not have to validate. Many of these are generally accepted Good Spectroscopic Practice requirements such as quantitation range and limit of detection and sensitivity but, again, emission spectroscopy adds chromophore-specific parameters of “Lifetime”, Quantum Yield” and “Anisotropy” into the mix.
In addition, the fluorescence technique adds many well-documented micro-environmental effects, such as “Quenching”, “Inter-filter effects”, pH, solvent etc. Fortunately, many modern monochromator-based, software-controlled systems are now incorporating both spectral correction algorithms and performance verification protocols into their systems.
Therefore, in conclusion, fluorescence spectroscopy is an extremely sensitive and powerful analytical technique, particularly when used in the “Bio” and Life Sciences arenas. However, when one considers developing a particular application based on this technique, with a view to using it in a variety of environments and on a range of instruments, it may serve you well to remember these words; “…truth emerges more readily from error, than from confusion”—Francis Bacon (1561).
References
- D. Thorburn Burns, “Robert Boyle and the birth of analytical spectroscopy”, in Spectrophotometry, Luminescence and Colour, Ed by C. Burgess and D.G. Jones for UVSG & CORM. Elsevier, Amsterdam, The Netherlands (1995).
- J.N. Miller, (Ed for UVSG), Standards in Fluorescence Spectrometry. Chapman and Hall, London, UK (1981).
- D.M. Hercules, Fluorescence and Phosphorescence Analysis. Interscience Publishers, New York, USA (1966).
- ASTM E2719-09; Standard Guide for Fluorescence-Instrument Calibration and Qualification. ASTM International, 100 Barr Harbor Drive, PO Box C700, West Conshohocken, PA 19428-2959, USA (2004).
- J.R. Lakowicz, Principles of Fluorescence Spectroscopy, 2nd Edn. Kluwer Academic/Plenum Publishers, New York, USA (1999). https://doi.org/10.1007/978-1-4757-3061-6