Daniel Kutscher, Marcus Manecki and Shona McSheehy Ducos
Thermo Fisher Scientific Bremen, Germany
Goal
To demonstrate the accurate determination of elemental impurities, especially As, in vitamin B12 according to the method outlined in USP chapter <233>, Elemental Impurities - Procedures. To demonstrate that triple quadrupole (TQ) inductively couple plasma mass spectrometry (ICP-MS) can be easy to use and methods can be set up through a dedicated tool, Reaction Finder, which automatically selects optimised parameters with respect to reaction gas and product ion mass.
Introduction
Vitamin B12 (or cobalamin) is one of the most commonly used vitamins for dietary supplementation. It plays a fundamental role in brain and nervous system functionality. Many supplements, some of which are available without a medical prescription, contain vitamin B12 at concentrations up to 5000 µg. Vitamin B12 is produced through fermentation using microbiological processes at a level of 10+ tons a year. Each B12 molecule contains one atom of Co, as seen in the chemical structure in Figure 1.
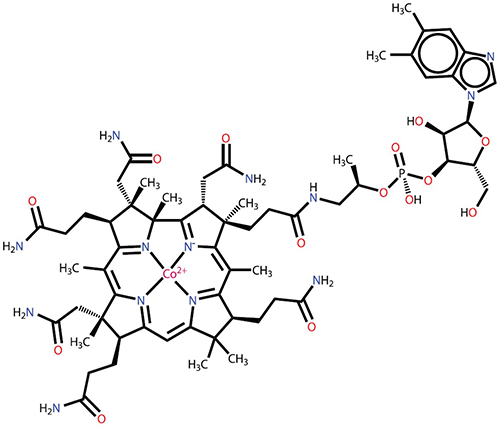
Figure 1. Chemical structure of vitamin B12.
The United States Pharmacopeia (USP) has published a dedicated chapter for elemental impurity limits in dietary supplements, Chapter <2232> Elemental Contaminations in Dietary Supplements; however, the analytical methodology for measuring the impurities is outlined in Chapter <233>. The revised USP Chapters <232>, Elemental Impurities – Limits, and <233> govern the determination of elemental impurities in drug products, are expected to become official from January 2018.1
Chapter <232> describes a set of maximum Permissible Daily Exposure (PDE) limits for elements in drug-related products. The PDE limits vary, based on the element and the administration route of the drug. Chapter <233> describes a procedure to validate an analytical technique for determining the impurities outlined in Chapter <232>. The chapter makes reference to two techniques, inductively couple plasma optical emission spectroscopy (ICP-OES) and ICP-MS, however, any analytical technique may be used as long as the necessary validation requirements are met. ICP-MS is a technique that is widely employed for the quantitation of trace elements at sub ng g–1 concentrations.
USP chapter <2232> also describes two basic options to test for elemental impurities, either analysing the product directly, or by using the individual component option for dietary supplements with maximum daily dosage of less than 10 g. In the latter case, it is sufficient for manufacturers to prove that the individual components do not exceed certain target limits for compliance. This offers the inherent advantage, that if a compound is used for several products, analysis is required only once.
ICP-MS is prone to interferences (as are all analytical techniques) which may bias the results. Of most concern are spectral interferences which are formed from the elements present in a sample, as well as components in the sample matrix (water, dissolved gases such as air and CO2, and acids such as HNO3 and HCl), and Ar which is used to form the plasma. Modern instrumentation offers effective tools for interference removal through the use of collision/reaction cell (CRC) technology, which are straightforward to use since there is a comprehensive interference removal mechanism based on the use of He as an inert collision gas and kinetic energy discrimination (KED). For some analytes, the use of reactive gases to trigger chemical reactions in the cell may produce superior results. However, the selection of a reactive gas is not straightforward and may lead to adverse effects for other analyte ions.
In some cases, the contribution of spectral interferences may be severe, making a more sophisticated interference approach necessary, such as that achievable with a TQ-ICP-MS. TQ-ICP-MS typically has a layout with a quadrupole before the CRC in order to select a range of ions that may enter the cell, while eliminating others.
Within the USP chapters, some contaminants are mandatory to be tested for, whereas others may be skipped based on risk-based strategies. Due to their natural presence and relatively high toxicity, As, Cd, Hg and Pb have been classified as Class 1 Impurities (also referred to as the “Big Four”) and must be quantified in all drug-related products. Of those four elements, As is generally considered to be a “difficult” analyte when measuring it by ICP-MS, since its ion yield is relatively low, and there are a number of spectral interferences which may affect the results.
Due to the amount of Co present in vitamin B12 (Co contributes about 3 % of the total mass of vitamin B12), a contribution of the polyatomic interference 59Co16O can be observed on the target mass of arsenic (which has one isotope with a mass of 75 amu). The interference from Co on As can be removed using O2 as a reaction gas which shifts the analyte mass from 75 amu to 91 amu.
The determination of As may also be affected by increased ionisation caused by the presence of carbon in the sample matrix. These ionisation effects may lead to false positive results for As, since compounds such as sugars, may add larger amounts of carbon to the overall sample matrix. This effect can also be seen for other elements with an elevated first ionisation potential, such as Se.
Instrumentation
All measurements were performed using a Thermo Scientific™ iCAP™ TQ ICP-MS. The instrument was operated using the Thermo Scientific Qtegra™ Intelligent Scientific Data Solution (ISDS™) Software and was calibrated daily using a mixed standard solution. The typical operation parameters are shown in Table 1.
Table 1. Typical instrumental parameters.
Parameter | Value | |
Nebuliser | MicroMist Quartz nebuliser | |
Spray chamber | Quartz cyclonic spray chamber cooled at 2.7 °C | |
Injector | 2.5 mm id, Quartz | |
Interface | High sensitivity (2.8 mm), Ni cones | |
RF power | 1550 W | |
Nebuliser gas flow | 1.11 L min–1 | |
QCell settings | SQ-KED | TQ-O2 |
Gas flow | 100 % He, 4.5 mL min–1 | 100 % O2, 0.35 mL min–1 |
CR Bias | –21 V | –7.5 V |
Q3 Bias | –18 V | –12 V |
Scan settings | 0.1 s dwell time per analyte, 10 sweeps | |
In order to select the appropriate instrument settings (reactive gas and product ion mass), the Reaction Finder feature of the Qtegra ISDS Software was used, which allows for method set up without detailed knowledge on potential reaction pathways caused by other sample components. For this work, Reaction Finder selected O2 for the analysis of As in TQ mode, and SQ-KED mode was selected for the analysis of the other elements, Cd, Hg and Pb, in Single Quadrupole (SQ) mode. Under these conditions, As is analysed at m/z 91, via the product ion of a controlled reaction with O2 to form 75As16O+. All other elements are analysed in the same mode as would be applicable to conventional SQ analysis.
Sample preparation
For the analysis of pure Vitamin B12, 10 mg of the solid was dissolved in 10 mL of 1 % HNO3 so that the initial dilution factor was 1000. This solution was further diluted before measurement (final concentrations denoted in the corresponding section). In addition, a vitamin B12 supplement was sourced locally. Since the supplement is water soluble, it was prepared for analysis via direct dissolution in dilute HNO3. One bottle containing 500 mg of solid and 7 mL of liquid was mixed according to the manufacturer’s recommendation, 1 mL of concentrated HCl was added to stabilise Hg in the sample solution, and was made up to 100 mL total volume with of 1 % HNO3 (v/v).
An internal standard solution was added to all vials manually such that each blank, standard and sample contained 1 ng mL–1 of Y and Bi. In a second preparation approach, butanol was added to all blanks, standards and samples to minimise differences in the carbon content between samples, and to mitigate ionisation enhancement effects on As and Se.
Only the “Big Four” elements were fully quantified, other elements, such as common catalysts (Ir, Os, Pd, Pt, Rh, Ru), were determined qualitatively through the acquisition of a full mass spectrum. As part of a risk-based strategy, these elements can often be excluded from the fully quantitative analysis. In this way, the workload for analysis can be reduced while still collecting evidence for the absence of those elements in a given sample.
Results
According to the individual component option in USP chapter <2232>, a product complies if the level of elemental impurities for each of the compounds does not exceed the values mentioned in Table 2. Using SQ-ICP-MS, As is generally analysed using KED in order to suppress polyatomic interferences such as 40Ar35Cl+; however, it also reduces oxide formation from typically around 2 % to less than 0.5 % (based on measurement of the CeO/Ce ratio).
Table 2. Applicable limits for individual components of dietary supplements with a maximum daily dose of 10 g.
Impurity | Value (mg kg–1) |
Inorganic arsenic | 1.5 |
Cadmium | 0.5 |
Lead | 1.0 |
Total mercury | 1.5 |
Inorganic mercury | 0.2 |
The analysis of pure vitamin B12 shows the striking difference between using SQ and TQ analysis modes. Results for both analysis modes are shown in Table 3 for purposes of comparison. This is due to a signal contribution from 59Co16O+ which cannot be fully suppressed by SQ-KED alone, even though its oxide formation is considerably lower (0.005 %) in comparison to Ce, which is generally used to characterise oxide formation in ICP-MS. This oxide level leads to an increased, false positive As blank equivalent concentration (BEC) of up to 2.5 ng g–1, without any As being present in the sample. This false positive would lead to an immediate failure according to USP chapter <2232>, since the maximum permitted concentration of As would be 0.15 ng g–1 after taking into account the sample dilution. When switching to TQ mode, the background signal derived from 59Co16O+ is eliminated, and complete recovery for a spiked solution containing 1 ng g–1 of As is achieved for four samples. The use of TQ mode with the O2 mass shift reaction also increases the detection sensitivity for As compared to its measurement in SQ mode with KED, as can be seen from the calibration curves in Figure 2.
Table 3. Comparison between SQ-KED and TQ-O2 modes for the analysis of As in a sample containing Vitamin B12 at different levels.
Concentration Vitamin B12 | Signal at m/z = 59 (SQ-KED) [CPS] | Signal at m/z = 75 (SQ-KED) [CPS] | BEC in SQ-KED mode [ng g–1] | Signal at m/z = 75 (TQ-O2) | BEC in TQ-O2 mode [ng g–1] | Spike recovery in TQ-O2 mode [%] |
BLK | 73 | 2 | 0.0008 | 4 | 0.0007 | N/A |
0.0001 mg mL–1 | 202,455 | 13 | 0.003 | 9 | 0.001 | 100.1 |
0.001 mg mL–1 | 2,174,144 | 88 | 0.02 | 10 | 0.001 | 99.5 |
0.01 mg mL–1 | 24,003,087 | 852 | 0.21 | 8 | 0.001 | 101.8 |
0.1 mg mL–1 | 243,093,619 | 8744 | 2.47 | 18 | 0.002 | 106.4 |
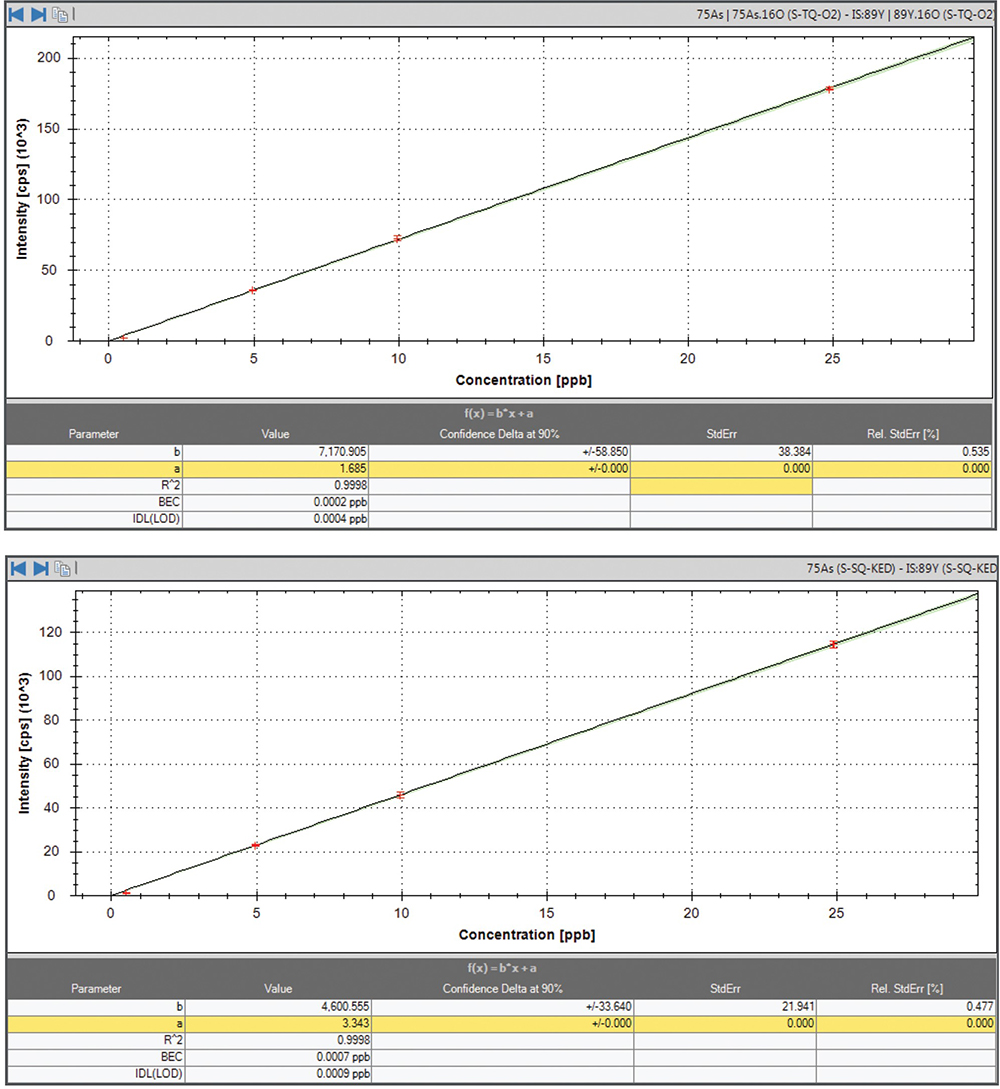
Figure 2. Calibration curves for As. Mass shift reaction using TQ-O2 (top) and SQ-KED (bottom).
The following text and data describe the results for the analysis of the dietary supplement. The first step in the validation process was to determine the accuracy of the method. To accomplish this, the sample was analysed with and without addition of all target elements, spiked at a concentration level of 0.5 J (Table 4 presents information on spike level).
Due to the relatively low concentration of vitamin B12 in the product (500 µg per dose), the background 59Co16O+ signal is not high enough to cause the product to fail the As limit test as per chapter <2232>, although there is a notable increase in the apparent As concentration observed in the SQ-KED mode. As can be seen in Table 4, the analysis result for As reveals a ten times higher concentration for As in the SQ-KED mode in comparison to TQ-O2.
As the results in Table 4 indicate, all elements had acceptable recoveries (±10 %), except As, which produced an elevated recovery of about 170 % in both modes of analysis. The increased recovery was likely caused by a change in the ionisation rate of As due to the presence of carbon-containing compounds such as amino acids (as indicated by the manufacturer). In order to alleviate this effect, butanol (1 % v/v) was added to all standards and samples and the analysis was repeated. The recovery results in the presence of butanol (shown in Table 4) demonstrate that carbon matching of the standards and samples when using external calibration is essential for ensuring accurate results.
Table 5 contains the calculated Instrument Detection Limits (IDL), describing what limits the instrument is able to detect as an analytical signal. Method Detection Limits (MDLs) were also calculated, to determine the minimal concentration of a given analyte in the original sample that can be detected.
Method detection limits are a more conservative estimate of the instrument detection limits, as they are determined on solutions that have been taken through all the relevant steps in the sample preparation procedure. For this application, sample preparation included only the dilution of the original sample by approximately 10-fold. As seen in the Table 5, the method detection limits are significantly lower than the applicable PDE limits.
Table 4. Results for the analysis of a vitamin B12 containing dietary supplement.
Element | Mode | Result [ng g–1] | Spiked concentration [ng g–1] | Recovery [%] | Recovery with butanol [%] |
As | TQ-O2 | 0.019 | 9.87 | 179 | 99 |
As | SQ-KED | 0.150 | 9.87 | 171 | 100 |
Cd | SQ-KED | Below IDL | 3.29 | 97 | 98 |
Hg | SQ-KED | 0.05 | 1.32 | 98 | 98 |
Pb | SQ-KED | 0.1 | 6.58 | 105 | 107 |
Table 5. Comparison of Instrumental Detection Limits (IDLs), Method Detection Limits (MDLs) and PDEs for the analytes in this study.
Element | Analysis mode | IDL [ng g–1] | MDL [ng g–1] | PDE limit [µg day–1] |
As | TQ-O2 | 0.003 | 0.04 | 15 |
Cd | SQ-KED | 0.001 | 0.01 | 5.0 |
Hg | SQ-KED | 0.001 | 0.01 | 15 |
Pb | SQ-KED | 0.001 | 0.01 | 5.0 |
Conclusion
Triple quadrupole technology can help to tackle difficult sample matrices, where contributions from matrix components lead to the formation of severe polyatomic interferences on the target analyte. In this work, the background signal on As caused by formation of 59Co16O+ was eliminated, while maintaining high detection sensitivity and excellent spike recovery.
The presence of carbon-containing amino acids in the sample matrix lead to an interference on the measurement of As. The resulting ionisation effects were mitigated with the addition of butanol to all standards and samples prior to analysis.
References
- United States Pharmacopeia chapter <2232>. https://www.usp.org/sites/default/files/usp/document/FAQs/ei-implementation-faq-2015-03-27.pdf