
Oscar Dominguez
Global Principal Geoscientist QAQC, Resource Centre of Excellence, BHP
Introduction
Current practices to evaluate the operation of sample stations that support processing and metallurgical balance are typically based on visual inspections. For example, material build-up on cutters, sample spillage, reflux while sampling, pegging on sizing screens and worn cutter lips are all most unwanted discoveries. But, being subjective observations, these do not allow quantification of the impact on the samples collected, production process or on the reliability of metallurgical balancing when deviations are found. For this reason, they are traditionally just considered as “good practice” recommendations or, N.B., as an extra cost for the business. Because they are only qualitative observations, it is quite difficult to generate and quantify a business case related to their impact with which to support an investment in better, i.e. more reliable, sampling systems. To complement the current visual regimen from a sampling and QA/QC perspective, this contribution illustrates the value of also using process monitoring practices, results and controls to proactively quantify the quality of the sample information, especially at the primary sampling stage. This allows the desired business cases to be completed with quantitative cost estimations.
Variability
Several papers have been published regarding the applicability of variograms as a useful tool to quantify industrial processing variability,1–3 including new developments with variograms targeting continuous monitoring of measurement system performance.4
This “proactive approach” includes the use of daily production grade information in variograms for control process to quantify the variability of each of the sampling points deployed in, for example, a metallurgical process.4,5 The most important advantage of this methodology is the use of the additional available information without extra budget requirements. This leads to higher monitoring relevance and reliability, because this augmented process modelling can be performed more frequently and the results will better reflect “day-to-day” variability in the process—which allows better insight in the process variability. The ultimate aim is to calculate the variographic nugget effect, V(0), better; i.e. the viewpoint where “a sample is compared against itself”, because this represents the total sampling-and-measurement error (expressed as a variance).
Bias testing
In industry, bias tests are often suggested, or contractually mandated, to compare a production sample obtained against the material it supposed to represent at the control point. Many international standards recommend bias testing—almost universally.
But bias tests require interruption of the regular production process in order to extract material from the conveyor belt with a mutually accepted “reference sampling” method. For this reason, bias tests are in reality not popular in industry (“we lose a lot of money and time having to interrupt our process many times”) and are, therefore, usually performed only reluctantly, or not at all! Because of this, companies are unavoidably exposed to higher risks than necessary, since it is simply assumed that the processes involved are not affected by a monitoring (i.e. sampling-and-analysis) bias. For this reason, “data quality representativeness” is an unknown characteristic. However, sadly, unchecked data obtained by process monitoring with un-evaluated methods are nevertheless very often still assumed to be the “truth”. There is a demonstrable loss of potential process information here and the ultimate question is not difficult to formulate: “what are the hidden costs involved for allowing this complacency?”.
Under the reasonable demand that a representative sample is one that accurately represents the “DNA of the lot material” by including all the components in the lot in their correct proportions, the “augmented proactive approach” to be presented below includes the use of grade–grain size distribution curves of the samples obtained daily. These can then be used as convenient reference information for process control. The following case example contains some technical details, which can be skipped if interest is solely in the economic consequences hereof.
Case example
This is an industrial example where a quality programme (QA/QC and QM) has enabled a new level of observation and quality quantification, developed and implemented after serious information gaps were determined by visual inspection.
- Visual field inspection of a key sample station revealed consistent deviations in the operations (Figure 1): a) the primary cutter is too narrow for coarse material, b) the secondary cutter is not working, the sample goes straight to the bucket, c) lumped material is not crushed, d) samples are not collected as per time requirements (electrical issues) and e) while the expected Nominal Top Size is 10 mm, the real Nominal Top Size 60 mm!
- Despite these deviations being correctly reported, the site team was struggling with communicating and getting the attention of senior levels, because the impact for the business calculations could not be quantified.
- Appropriate variogram analysis was performed over the three sample stations at the site (Figure 2), which showed that the error of the singular failing station was three times larger than for the other two. Thus, the impact on sampling variability was finally quantified, the consequence of which is an increased risk for a non-compliant product, endangering the bottom line.
- In terms of Bias, the grain size distribution of the failing sample station 3 was compared against the same material sampled at the loading port, and a preferential trend towards collecting more fine material on site could be observed. This allowed the quantification of the underestimation of the grades reported from this sample station (Figure 3).
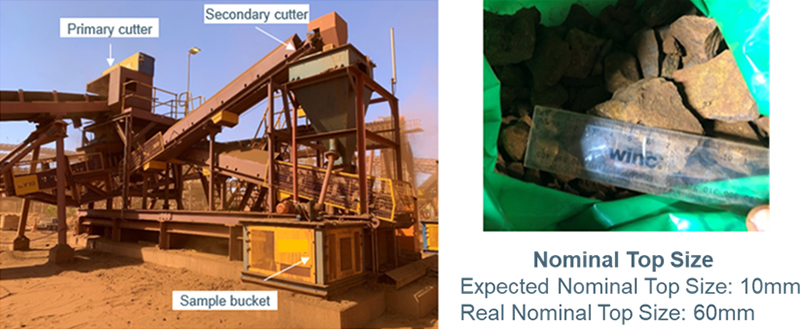
Figure 1. Quantified field evidence (right) collected after a visual inspection of the primary sample station shown on the left. The deviation between the expected nominal top particle (10 mm) and the factually observed size is dramatic.
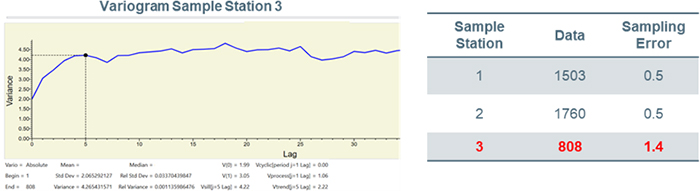
Figure 2. Variograms performed for the three sample stations at the key site shown in Figure 1. Sample Station 3, the one identified and highlighted by visual inspection, clearly shows the largest Total Sampling Error. Variogram analysis is consistent with the visual inspection, and now quantified.
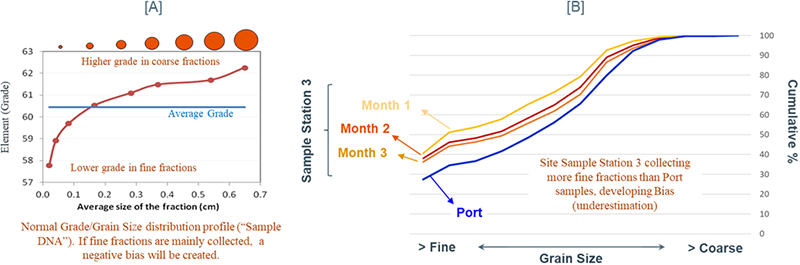
Figure 3. [A] Normal grade/grain size distribution profile (the “sample DNA”) shows the impact on the overall sample grade if a preferential extraction of fine, or coarse, fractions prevail—this will assuredly generate a bias. [B] Grain size distribution analysis performed on samples from the faulty sample station 3, as compared with the same material sampled at the loading port, attesting to the same biased extraction of too much fine material.
Quantification at last
Variograms and grain size distribution analyses are here suggested to be used as the base for a proactive approach in production. Where performed, the impact of the deviations originally observed by on-site visual inspection only, could now be better quantified and communicated to the organisation. In terms of variability, the market always values long-term stability in the product, where any consistent variability reduction can represent an opportunity for a higher price during contract negotiation. For the mass product industry this represents a very important revenue opportunity due to the millions of tonnes produced in general by mining companies. This is why a continuous monitoring and quantification can lead to these, easily utilised opportunities.
In terms of bias, percentage deviations as small as 0.1–0.5 % bias are normally just considered as “minor” in some production environments. However, and due to the number of tonnes produced, these “minor” differences can represent a huge business impact. For example, for a mine producing 10 M tonnes, a 0.1 % Fe and 0.5 % Fe bias can represent an impact of US$1.6 M and US$8 M, respectively (assumptions: iron ore fines are based on the 62 % index, with an average price of US$100).
Conclusions
International Standards (depending on the commodity) are used to establish the methodology to be followed to setup and operate sample stations, but these requirements are normally only inspected or audited visually, compromising a full quantitative assessment of sample stations performance.
The risk for companies relying only on visual, qualitative assessments is creation of a potentially “false sense of security”, where no detrimental issues are noted, or, when major defects are detected, impacts and risks are very hard to quantify to develop a relevant remedial “business case”.
This contribution presented a case example showing the importance of implementing a QA/QC and QM programme on sample stations, as a complement or enabler of a sustainable compliance to International Standards. But also to further the opportunity of quantifying the performance of sample station performance, and to provide a “proactive approach” regarding deviations in the mining plan. This will potentially reduce operative costs, e.g. optimising the ore processing circuit), or optimising a blending process a.o. all of which will lead to an improved and optimised resource value.
Never underestimate the value of even a “minor bias”—your extra costs may be anything but minor!
References
- R. Minnitt and F.F. Pitard, “Application of variography to the control of species in material process streams”, J. S. Afr. Inst. Min. Metall. 108(2), 109–122 (2008). https://www.saimm.co.za/Journal/v108n02p109.pdf
- R.C.A. Minnitt and K.H. Esbensen, “Pierre Gy’s development of the Theory of Sampling: a retrospective summary with a didactic tutorial on quantitative sampling of one-dimensional lots”, TOS Forum 7, 7–19 (2017). https://doi.org/10.1255/tosf.96
- K. Engström and K.H. Esbensen, “Variographic assessment of total process measurement system performance for a complete ore-to-shipping value chain”, Minerals 8(7), 310–334 (2018). https://doi.org/10.3390/min8070310
- E.I. Wikstrôm and K. Engstrom, “Development of automated variographic characterisation for continuous monitoring of measurement system performance in iron ore processing - a case study at LKAB, Sweden”, in 9th World Conference on Sampling and Blending (WCSB9), Ed by WCSB9 Organising Committee (2019).
- O. Dominguez, “Quality assurance quality control (QAQC) and quality management (QM) programs on sample stations: a prerequisite to achieve standards requirements”, in 9th World Conference on Sampling and Blending (WCSB9), Ed by WCSB9 Organising Committee (2019).

Oscar Dominguez
Oscar Dominguez is a Geologist, Master of Business Administration (MBA), and Geo-Mining-Metallurgical Diploma, with >20 years of international experience developed in the mining industry and multi commodities. Council member of the International Pierre Gy Sampling Association (IPGSA). 16 years working in BHP, currently as Global Principal Geoscientist QAQC, at the Technical Centre of Excellence, providing support on Sampling & QAQC to all the assets and commodities of BHP.
[email protected]
