Ian S. Gilmore,a Satoka Aoyagi,b Ian W. Fletcherc and Martin P. Seaha
aNational Physical Laboratory, Teddington, Middlesex, TW11 0LW, UK. E-mail: [email protected]
bFaculty of Life and Environmental Science, Shimane University, 1060 Nishikawatsu-cho Matsue-shi, Shimane, 690-8504, Japan
cIntertek MSG, Wilton Centre, Redcar, TS10 4RF, UK
Introduction
The chemistry at surfaces and interfaces is of major importance to the correct operation of many high-innovation products including drug delivery systems, medical devices, organic electronic displays and personal care products. Secondary ion mass spectrometry (SIMS) has become a successful and popular technique to study such materials owing to its high chemical specificity, ppm surface sensitivity and the ability to image with spatial resolutions of hundreds of nanometres.1 More recently, the ability to molecularly image many organic materials in 3D with depth resolutions up to 5 nm has become possible. This measurement breakthrough allows complex structures such as a pixel from an organic light emitting diode to be characterised in exquisite detail. However, a complication and barrier to wider uptake of SIMS, especially for organic materials, is the complexity of the mass spectrum. To help analysts, the G-SIMS2 method (from gentle-SIMS) was developed to simplify the spectra and provide direct interpretation based on the physics and chemistry of the SIMS process rather than on statistical analysis techniques such as principal component analysis (PCA) or library matching methods. This has led to a family of methods with the “G” prefix, which coincidently started at around the same time as that other popular family of products manufactured by Apple®. This article provides a short introduction to the G-family.
G-SIMS
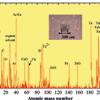
It is first necessary to outline the essential processes in SIMS. Primary ions with typically tens of keV energy impact a surface depositing that energy over a few tens of nanometres depth causing an energetic collisional process, which depends on the primary ion energy, number of atoms in the ion, their atomic number and the properties of the sample. Secondary ions are liberated from the surface which, for an organic substance, are predominantly heavily fragmented or structurally re-arranged.1 In the early development of SIMS for organic materials, libraries of spectra were developed for “fingerprint” matching. These have now grown to cover approximately a thousand substances. A recent analysis of the PubChem substance database (see http://www.ncbi.nlm.nih.gov/pccompound) shows that there are over 70 million substances in the mass range relevant to SIMS. Consequently, experimental libraries will always be useful but contain a very limited subset of materials. Figure 1 illustrates the issue with a mass spectrum of an industrial antioxidant, Irganox 1010, a phenolic antioxidant used in the polymer industry, deposited onto a silver substrate. It is clear that there are many peaks and by progressively zooming in on smaller and smaller regions we see the complexity of the spectrum.
 illustrating the complexity of the mass spectrum. Note, for clarity, the inset only shows one molecule on the surface whereas the spectrum is for a monolayer of molecules.")
A schematic of the SIMS process is shown in Figure 2 for a surface covered with folic acid molecules analysed with a beam of 25 keV Bi+ ions. The impact of a single Bi+ ion is illustrated (in reality, approximately a million ions per second are fired) with the emission of secondary ions from the surface. At the point of impact there is a high energy density (coloured red) and the emitted secondary ions are heavily fragmented components of the folic acid molecule. Rearrangements to more stable structures also occur; these are often ubiquitous ions offering no diagnostic ability. The energy density a few nanometres from the point of impact is lower, so more intact fragments are emitted. Intermediate fragments are emitted between these zones. In SIMS, the mass spectrum is the sum of all these secondary ions, which is, unfortunately, dominated by the fragment ions making the spectrum complex and difficult to interpret, as was shown in Figure 1.

For a given energetic condition of the primary ion beam (particle atomic number and energy) there will be a characteristic population of intact and fragmented secondary ion fragments. At less energetic conditions, the relative population of the more intact fragments is expected to increase and vice versa. This behaviour was found experimentally and a description developed2 in terms of a population of fragments described by a partition function with a characteristic surface temperature, Tp. The G-SIMS theory2 shows that for two spectra with peak intensities S1x and S2x at mass Mx acquired with different ion beam conditions and consequently different surface temperatures, T1 and T2 (where T1 < T2), that it is possible to extrapolate to a new spectrum at a much lower temperature. This, the G-SIMS spectrum, Gx, is simply computed as

where g is an extrapolation index, known as the g-index. Typically, this has a value of 13 and ranges from –1 (i.e. the G-SIMS spectrum is effectively the high fragmentation spectrum) up to 40 (equivalent to a spectrum with very low fragmentation conditions). At a g-value of 0 the G-SIMS spectrum is effectively that of the low fragmentation condition. The mass term, Mx, simply scales up the intensity at higher masses where the secondary ion yields in the SIMS process are weaker. In the G-SIMS spectrum, the most structurally significant ions are clearly prominent and the degraded and rearranged fragment ions are suppressed.
In practice then, G-SIMS requires two spectra to be acquired, S1x and S2x, with low and high fragmentation ion beam conditions, respectively. It was found originally that a stronger difference in these fragmentation conditions could be achieved if two different primary ion masses were used rather than different energies. At that time, caesium primary ions for S1x and argon ions for S2x were a popular choice. Figure 3 shows the G-SIMS spectrum for the same Irganox 1010 material for comparison with the SIMS spectrum shown earlier. It is very clear that the G-SIMS spectrum is much easier to interpret with peaks clearly related to the molecular structure shown in the inset. G-SIMS has now been successfully applied to a wide variety of pure substances including polymers and complex molecules.
3 is labelled “But”.")
A barrier for the wider uptake of G-SIMS into the surface analysis community was the requirement for two ion beams producing suitably different fragmentation conditions and the need for their spatial registration (spatial alignment) at the surface, which is especially important for heterogeneous samples. The most popular primary ion source is the liquid metal ion source, which is now sold with almost every new time-of-flight SIMS (ToF-SIMS) instrument. Recently, a novel bismuth–manganese emitter3 known as the “G-tip” has been developed as a popular liquid metal ion source. This simplifies the alignment and gives excellent G-SIMS imaging and spectroscopy without significantly compromising the bismuth cluster ion beam performance. G-SIMS has now become accessible to many analysts, and the software to compute G-SIMS spectra has been incorporated directly into some vendor’s software. With the G-tip, the S1x and S2x spectra are acquired with Bi and Mn ions, sequentially. This is achieved simply by computer control without any special alignment or optimisation. Indeed, in future, it may be possible to generate G-SIMS spectra by acquiring data using a repeating pattern of pulses of Bi ions followed by pulses of Mn ions. Serendipitously, in an analysis of the characteristics of monatomic primary ion sources to generate G-SIMS spectra it was found that Bi and Mn give the biggest difference in fragmentation in the S1x and S2x spectra giving optimum G-SIMS conditions.
Separating mixtures—the g-ogram
As discussed earlier, a great advantage of SIMS is that the analysis is direct and has excellent spatial resolution approaching a few hundred nanometres. However, the lack of the usual capability of using separation methods in mass spectrometry, such as chromatography or ion mobility, combined with the complexity of the heavily fragmented ions in the spectra means that the interpretation of multi-component spectra in SIMS is very challenging indeed. The requirements for high-definition imaging, with say 256 × 256 pixels, in around 10 minutes analysis time places significant constraints on the instrument design so that separation using methods such as ion mobility with flight times of milliseconds are incompatible. Clearly, traditional liquid and gas chromatographies are not at all possible.
In Equation (1), the g-index allows the amount of fragmentation in the G-SIMS spectrum, with a value of –1 giving essentially the S2x spectrum, a value of 0 yielding the S1x spectrum, and a high value of 40 giving a spectrum with very low fragmentation. If different substances require characteristic fragmentation energies then the g-index is, in effect, a separation parameter. This concept was developed by Ogaki et al.4 who showed that it may be used to “chromatographically” separate the mass spectrum of a drug molecule from a polymer matrix using the so-called g-ogram.4 This is a significant advance since most technologically important samples are not, of course, pure components but are complex mixtures often with impurities and other contaminants.
The g-ogram is an intensity map of the G-SIMS intensities normalised to the maximum intensity at each value of g from –1 (high fragmentation) to 40 (very low fragmentation) in increments of 0.1 for each mass, Mx. Effectively, this is like a traditional chromatogram with the separation parameter, g, related to the fragmentation energetics of the ion formation. For each mass peak, Mx, there are vertical streaks of intensity. Those that are bright to begin with and fade away as g increases (down the image) are from processes that involve more energy and fragmentation. Conversely, those peaks that are dark initially and then become bright at higher g values are from processes requiring less energy and fragmentation.
 positive-ion SIMS spectrum using 25 keV Bi+ primary ions. The peaks are coloured red, green and blue for the conditions of –1 ≤ gmax < 1.7, 1.7 ≤ gmax < 3.4 and 3.4 ≤ gmax < 40 and are separated in (b), (c) and (d), respectively, as discussed in the text.")
Recently, the g-ogram method has been applied by Aoyagi et al.5 to a sample consisting of a silicon wafer substrate coated with the protein lysozyme and possibly one or more contaminations from processing. The positive-ion SIMS spectrum using Bi+ primary ions (S1x) is shown in Figure 4. The peaks are displayed in three colours which we explain later. The spectrum is complex and consists of ions from the substrate, the contaminants and the protein. Resolving the constituents by multivariate analysis methods would require analysing many samples that would, in many cases, simply not be available. The corresponding g-ogram is shown in Figure 5 calculated from the S1x spectrum acquired with Bi+ and the S2x spectrum acquired with Mn+. A horizontal line may be moved up or down with its position set at a value gsep. For each peak, Mx, there is a g-value where its intensity is a maximum, known as gmax. It is easy to identify which peaks have gmax < gsep and which peaks have gmax ≥ gsep. It is clear from Figure 5 that there are two bands of peaks that may be separated by a horizontal line at gsep = 3.4. Further inspection of the g-ogram by adjusting the horizontal line revealed a possible third separation at gsep = 1.7 and the computer program allows the three bands to be selected and the mass peaks coloured. In Figure 4, the peaks are coloured red, green and blue for the conditions of –1 ≤ gmax < 1.7, 1.7 ≤ gmax < 3.4 and 3.4 ≤ gmax < 40, respectively, and the spectra for each of the three components are also plotted separately as Figures 4 (b), (c) and (d). The spectrum (red) in Figure 4 with –1 ≤ gmax < 1.7 consists of peaks from the substrate and also the characteristic fragments of the well-known contaminant polydimethysiloxane (PDMS). This has the convenient advantage that the G-SIMS spectrum, shown later, filters out the PDMS contamination.

The spectrum (green) for the intermediate condition 1.7 ≤ gmax < 3.4 reveals a peak at 182.18 Da which is interpreted to be a dicyclohexylammonium salt or similar contamination. This was unexpected and is believed to come from cross-contamination in the sample preparation procedure. This spectrum also contains one peak at 130.07 Da from C9H8N+ relating to tryptophan (W) or possibly from the dicyclohexylammonium salt.
The third spectrum (blue) for 3.4 ≤ gmax < 40 consists of all the expected peaks for the amino acids in lysozyme. In effect, without any prior knowledge of the sample or pre-selecting ions, the g-ogram method has separated the spectrum shown in Figure 4(a) into the three critical components; the substrate and PDMS contamination (red), an unexpected contaminant which is interpreted to be dicyclohexylammonium or similar along with one peak relating to tryptophan (green), and all the peaks expected from the literature for the amino acids in lysozyme (blue). Examining Figure 4(a) again, now with the colours identified, reveals how complex the spectrum is with peaks from the different components mixed together. Note that multivariate methods such as PCA, if a suitable data set were available, would struggle to separate out the protein-related peaks since they are, on average, a factor of ten or more weaker than other secondary ions.
G-SIMS and informatics for substance identification
So far, the G-SIMS and g-ogram methods have simplified the mass spectra to retain only structurally significant ions and also separate out components from a mixture based on the fragmentation energy for each component. This is, of course, a major boost for the analyst faced with an unknown material. The next step forward is to be able, automatically or semi-automatically, to identify substances using informatics methods. As previously discussed, the mass spectrometers used for SIMS do not have the high mass accuracy or MS/MS capability (a method to break the molecule down to smaller components) common in high-performance mass spectrometers used for substance identification. Automatic identification is consequently something of a challenge. However, two promising approaches have been developed to help guide analysts based on G-SIMS spectra which have some similarities with MS/MS spectra. We briefly outline these in the following. First, a method was developed for simulating fragmentation pathways6 based on the popular simplified molecular-input line-entry specification (SMILES) molecular structure format. A computer program developed at NPL (National Physical Laboratory, UK) simulates the fragmentation pathways by recursively breaking all bonds except bonds to hydrogen and aromatic rings. The simulated fragmentation pathways were then compared with experimental fragmentation pathways that may be identified by varying the g-index parameter. For Irganox 1010, folic acid, valine, tyrosine and a simple peptide, valine–tyrosine–valine, it was found that approximately 90% of the G-SIMS fragmentation pathways could be explained. Subsequently, this method has been developed into a fragmentation database known as G-DB1 that will be accessible directly from the internet. The database can be directly linked to any of the freely available chemical databases such as PubChem, ChemSpider, KEGG and LipidMaps. A second approach has been to use the G-SIMS spectra as a bridge to informatics methods developed for MS/MS spectra of metabolites, called MetFrag. This works by searching PubChem, Chemspider and KEGG databases against the mass of the parent ion taking into account the addition or loss of hydrogen depending on the charge state. Candidate molecules are then fragmented, in a similar way to G-DB1, to the second level of fragmentation tree. Bonds in ring systems are treated specially. The algorithm takes into account neutral losses of H2O, HCN, NH3, CH2O and HCOOH from fragments. Bond dissociation energies are also calculated. The results for each candidate ion are then scored against the key peaks and intensities in the MS/MS spectrum. Initial tests have shown that this works very effectively for G-SIMS spectra of Irganox 1010, folic acid, caffeine, cholesterol and phenylalanine. This method is promising but for efficient use requires the mass accuracy of SIMS instruments to improve7 from typical present accuracies of around 50 ppm to 5 ppm or better, which is typical for mass spectrometers used for organic analysis. This improvement is certainly possible and is already becoming available with new spectrometer designs.
Conclusions
Secondary ion mass spectrometry has become a powerful analytical technique for the analysis of complex organics. However, the complexity of the mass spectra makes spectral interpretation more difficult compared with, for example electrospray mass spectra, and consequently this has been a barrier to wider uptake. The “G” family of methods developed at NPL, with collaborators, includes G-SIMS, G-tip, g-ogram and G-DB1 that give methods for spectrum simplification, G-SIMS imaging, separation of mixtures and linkage with informatics methods. Higher performance mass spectrometer designs are now being developed which will allow improved integration with informatics methods and more effective identification of substances. When combined with the amazing advances in 3D molecular imaging and recent improvements in spatial resolution to better than 50 nm, the future for SIMS is very exciting!
Acknowledgements
This work forms part of the Chemical and Biological Metrology Programme supported by the National Measurement System (NMS) of the UK Department of Business, Innovation and Skills (BIS).
References
- J.C. Vickerman and I.S. Gilmore, Surface Analysis The Principal Techniques, 2nd Edn. Wiley (2009). doi: 10.1002/9780470721582
- I.S. Gilmore and M.P. Seah, “Static SIMS: towards unfragmented mass spectra—the G-SIMS procedure“, Appl. Surf. Sci. 161, 465–480 (2000). doi: 10.1016/S0169-4332(00)00317-2
- F.M. Green, F. Kollmer, E. Niehuis, I.S. Gilmore and M.P. Seah, “Imaging G-SIMS: a novel bismuth-manganese source emitter“, Rapid Commun. Mass Spectrom. 22, 2602–2608 (2008). doi: 10.1002/rcm.3648
- R. Ogaki, I.S. Gilmore, M.R. Alexander, F.M. Green, M.C. Davies and J.L.S. Lee, “Surface mass spectrometry of two component drug–polymer systems: novel chromatographic separation method using gentle-secondary ion mass spectrometry (G-SIMS) “, Anal. Chem. 83, 3627–3631 (2011). doi: 10.1021/ac200347a
- S. Aoyagi, I.S. Gilmore, I. Mihara, M.P. Seah and I.W. Fletcher, “Identification and separation of protein, contaminant and substrate peaks using gentle-secondary ion mass spectrometry and the g-ogram“, Rapid Commun. Mass Spectrom. 26, 2815–2821 (2012). doi: 10.1002/rcm.6409
- F.M. Green, E.J. Dell, I.S. Gilmore and M.P. Seah, “Identification of complex molecules at surfaces: G-SIMS and SMILES fragmentation pathways“, Int. J. Mass Spectrom. 272, 38–47 (2008). doi: 10.1016/j.ijms.2007.12.016
- F.M. Green, I.S. Gilmore and M.P. Seah, “Mass spectrometry and informatics: distribution of molecules in the PubChem database and general requirements for mass accuracy in surface analysis“, Anal. Chem. 83, 3239–3243 (2012). doi: 10.1021/ac200067s