
Ronnie Gallagher
Adrok Ltd, 49–1 West Bowling Green Street, Edinburgh EH6 5NX, UK. E-mail: [email protected]
Introduction
The field of remote sensing is broad and has a variety of applications, from environmental monitoring to military imaging and use by civilian businesses. A very wide part of the electromagnetic spectrum is available to remote sensing scientists giving access to information on scales from the cosmic down to the micro. However, the study of the earth’s sub-surface has generally been left to low technology techniques such as seismic or physical coring of areas of interest.
Both seismic and borehole cutting are potentially environmentally disruptive, requiring the use of percussive forces for seismic and road infrastructure for bringing drilling rigs onto a site of interest for cutting cores. And for delicate sites in need of preservation, such as archaeologically important areas, or as part of the built environment, physically damaging technologies are less than ideal for investigating such areas.
Thus, there is a need for a less disruptive method of exploration. For water, minerals, oil and gas this means a technology whereby sites can be dismissed without the need for expensive and time-consuming techniques and only places with a higher probability of successful recovery can then be focused on.
Moreover, it is important that places of archaeological and architectural importance need to be explored without damage. Atomic Dielectric Resonance (ADR) can be used for identifying sub-surface geological features.
Atomic dielectric resonance—the technique and technology
ADR uses novel resonance properties of radio waves from X-band and C-band radar, having been developed using knowledge gained from the aerospace, remote sensing and imaging industries. This technology1 uses a novel coherent beam, which has been used in the oil, gas and water industries, to provide information on what lies beneath the earth’s surface, without the need to drill cores.
ADR technology is being applied to smaller scale laboratory investigations in a new form of spectroscopy. To this end, a test chamber has been constructed that is portable enough to be taken to different sites around the world (see Figure 1).
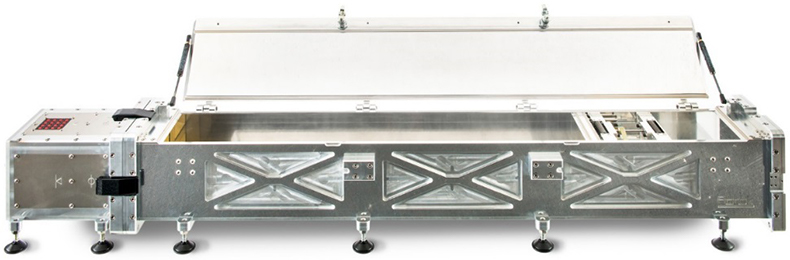
Figure 1. ADR chamber.
Although Adrok Ltd works mainly on geological features and associated rocks and minerals, the technology has been used in the field of biology and therefore has broad potential applications.
Working in the microwave region of the spectrum the low energy wave forms have the ability to penetrate and return data from the interior of materials, rather than merely getting information taken from the surfaces of solids.
The laboratory equipment set-up uses a frequency of 1 GHz (30 cm l) to illuminate samples in the chamber and this can be detected after interacting with the sample, usually in reflection mode (as with radar). However, there is also interest in using the technology for trans-illumination experiments.
The readings obtained yield information that is gleaned from the way that the technology uses the mathematical and statistical methods of ADR analysis to produce synthetic relationships which can then be used to compute very precise values of: (i) dielectric permittivity (e), (ii) magnetic permeability (m) and (iii) electric conductivity (s).
Application examples
Dielectric permittivity measurements are one of the major functions used for sub-surface mapping. This method gives lithological information that helps to display the boundaries between different strata (see Figure 2). However, by understanding the dielectric properties of different materials one can also try to define what materials lie at the boundaries.
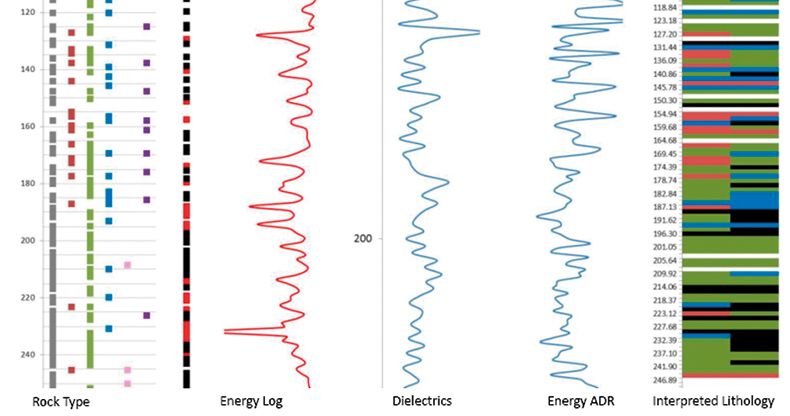
Figure 2. Lithological log and depth in metres.
Although the bandwidth of the transmitted pulse is 1 GHz, received signals can be from 100 MHz to 51.2 GHz by digitally analysing the information from 1024 data point samples using fast Fourier transform (FFT) methods. Thus, a variety of other measurements can be made, which when taken together should give a specific signature for the material under investigation.
Such measurements include Spectral Line analysis, ADR Resonant Energy Ratio and the ADR Energy Gamma method, a sample of the latter is shown in Figure 3. This figure shows differences in ADR E-Gamma amplitudes at different frequencies of a variety of rock types—calcite, galena, marcasite and sphalerite.
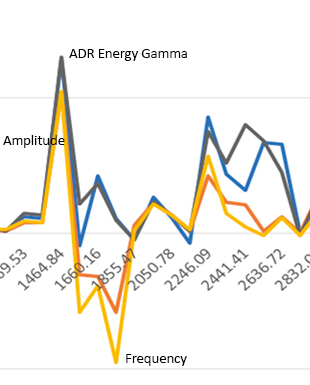
Figure 3. Example of ADR energy gamma from rock samples. (calcite; galena; marcasite; sphalerite).
Other measures use signal frequency and energy returned to give a broad range of metrics which aims to give a comprehensive picture of the material of interest. This wide range of measurements requires specialist computer software to make the best use of the information returned from the scanner.
Hence, a suite of proprietry software tools has been developed to undertake the typecasting function; this includes the ability to perform Fourier transform processing of images. By setting up a typecasting database using known samples an endeavour is made to match unknown samples of different materials to those within the database.
The technology has already been used on the large scale on some noteable projects. Civil engineering often has the requirement to gauge the nature of the ground that construction projects are taking place on. And in this case Adrok and its forerunner company Radar World have been involved in many projects where archaeology and civil engineering worked in tandem.
ADR measurements in an historic London Underground Tunnel
In 1993, at the behest of English Heritage and London Underground Limited, ADR technology was used to undertake scans to provide information on the construction techniques used on the world’s first shield driven tunnel: Sir Marc Brunel’s 1200 ft (366 m) long tunnel beneath the River Thames. Using specialist antennas and the propriety WARR (Wide Angle Reflection and Refraction) technique, an accurate structural analysis of the twin brick arch structure was provided from inside the tunnel. Furthermore, the plots of the riverbed derived from the scans, taken looking up through the tunnel towards the river, showed good correlation with the work of Sir Arthur Skempton who had studied the riverbed in detail from above.
ADR in analysis of disease
An example of laboratory based spectroscopy using ADR is the attempt to identify sporadic Creutzfeldt–Jakob disease (sCJD) and its infectious relation, variant CJD (vCJD), which are caused by a mutated Prion protein, with the normal form known as PrPC and the mutant form designated PrPSc.
Using known samples of the aforementioned diseases and other neurological conditions, a database of information gleaned from ADR analysis was built up. Due to the nature of these diseases the sample sizes were small in number, however, from this database algorithms were derived indicating that differences between the disease groups could be detected.
To extend the work, blood from sCJD patients and vCJD infected individuals was tested against samples taken from normal donors and neurological control patients in two separate studies. The first study was essentially a training exercise to evaluate whether the discrimination was reliable and used some blinded samples (where the type of sample is unknown) amongst known samples.
Results from study number one showed that more information was required to enable the expert systems to function at the required level of statistical significance. Therefore, the identities of all samples were given and the results fed into the algorithms to enhance the specificity of the results.
For the second study a small number of blinded samples was put through the testing regime and the results analysed, again these consisted of normal and disease controls as well as samples from sCJD and vCJD patients.
With the increased reliability derived from including all the data from the first study into the algorithms, the unknown samples were identified with 100% accuracy.2
While Fourier transform infrared (FT-IR) spectroscopy had previously been used for detecting disease markers for these conditions, this required special sample preparation procedures. Whereas, ADR can be used on unprocessed samples and can utilise a very wide spectral frequency range; the final results gave indicators that were likely to have been due to more than just low levels of the PrPSc present in blood of infected individuals. This work shows the potential utility of the technology in solving problems in the field of medicine and biology.
Summary
Presently ADR is being used mainly in field and laboratory investigations in the areas of geology/geophysics/mineralogy. Large companies involved in these fields are starting to take a greater interest in what it is that the technology has to offer and the instrument company’s field teams are being deployed to all the continents, save Antarctica. However, in future, the hope and expectation is that the technology will be found in other settings, including health and biology. Indeed, as this article is going to press a potential academic collaboration in a biological application is about to be explored.
References
- G.C. Stove, “Radar apparatus for imaging and/or spectrometric analysis and methods of performing imaging and/or spectrometric analysis of a substance for dimensional measurement, identification and precision radar mapping”, US Patent 6,864,826 (8 March 2005).
- T.J. Fagge, G.R. Barclay, G.C. Stove, G. Stove, M.J. Robinson, M.W. Head, J.W. Ironside and M.L. Turner, “Application of atomic dielectric resonance spectroscopy for the screening of blood samples from patients with clinical variant and sporadic CJD”, J. Transl. Med. 5, 41 (2007). doi: http://dx.doi.org/10.1186/1479-5876-5-41