Jean-Yves Colle,a Dario Manara,b Thorsten Geislerc and Rudy J.M. Koningsa
aEuropean Commission, Joint Research Center, PO Box 2340, D-76125 Karlsruhe, Germany.
bEuropean Commission Joint Research Centre, Via Enrico Fermi, 2749, I-21027 Ispra (VA), Italy
cInstitute of Geosciences, University of Bonn, Bonn, Germany
Contact
J.Y. Colle: [email protected];  0000-0003-4242-8083
D. Manara: 0000-0002-0767-9859
T. Geisler: 0000-0003-1923-2023
R.J.M. Konigs: 0000-0001-6113-2128
Raman spectroscopy is a powerful technique to identify and structurally or chemically characterise chemical compounds in the condensed or gaseous states, including hazardous and highly radioactive materials. It is principally non-destructive, can be performed at distance (up to few tens of metres) and through transparent and semi-transparent shielding screens. It is thus not surprising that it is widely used in industry and research, but also by customs, the police, military, hazmat and in medicine. To meet the different demands, the size of the instruments range from handheld devices, dedicated to fast identification of materials or chemicals, up to high-end and high-resolution scientific instruments.
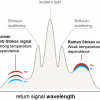
Raman spectroscopy is based on the indirect measurement of the energy of vibrational transitions of chemical bonds after they have been excited into a virtual vibrational state by monochromatic laser light (photons). The transition energy is thereby revealed through inelastic scattering of the incident photons after their interaction with the interatomic vibrations of the material. The inelastically scattered photons lose (Stokes Raman bands) or eventually gain (anti-Stokes) energy if the bond excited by the photon was originally in a high energy state and does not return to its original ground state. Each vibration transition is thus revealed by a relative shift of the wavelength of the scattered light relative to that of the incident light. Thereby only one photon out of 108 photons undergoes Stokes scattering and even fewer photons anti-Stokes scattering. The Raman signal is thus quite weak compared with the intensity of elastically scattered photons. On the other hand, those vibrational transitions are very specific to distinct chemical bonds, resulting in a unique Raman spectrum fingerprint for each material. Additionally, as chemical bond vibrations are sensitive to temperature, mechanical pressure and the molecular environment (for instance, crystal structure, lattice defects, impurities and crystallite size), the Raman spectrum is influenced by those parameters and can thus be used to deduce structural information from it. Measurements carried out with polarised light can even give information about the orientation of the bonds in a crystal.
Raman scattering is best observed with a high-power, monochromatic photon beam. For this reason, the rapid progress of laser technology in the last four decades has broadly improved the quality and the applicability of Raman spectroscopy to the most diverse range of solid, liquid, and gaseous materials and compounds. In modern instruments the measurement is performed by the illumination of the sample with a laser generally through a single objective, such as the one of a microscope and by the analysis of the scattered light with a spectrometer.
In the nuclear field, Raman spectroscopy has been used already for a few decades for the study and identification of actinide compounds.1 The specific problem in this case is the radiation of the samples, which is hazardous to the operator, and can also deteriorate the instrumentation. When working with nuclear materials, one has to deal with several types of radiation. Actinides, such as uranium or plutonium, emit alpha radiation, which is easily shielded, but needs strict confinement to avoid incorporation during handling. Other actinides such as americium or used nuclear fuel emit gamma radiation that is highly penetrating and needs shielding and/or very small sample sizes. The traditional and obvious way to deal with this is to use a remote optical head connected via glass fibres to the spectrometer.1 While the head is in the shielded confinement where the radioactive material is, the spectrometer is outside. This configuration, however, reduces the measurement flexibility as remote heads have specific requirements. An alternative is to place a full instrument in a glove box or hot cell, but this is only possible if the radiation dose is low so that no damage occurs to the instrument.2
A recent development is a compact confinement of radioactive material,3,4 which allows use of a conventional Raman configuration with all its possibilities, resulting in innovative Raman applications on actinide compounds and other nuclear materials. The compact confinement (Figure 1) described in Reference 3 consists of an acrylic glass cylindrical capsule containing the sample just below an optical window. A system of plastic bag tunnels enables the transfer of the radioactive sample into the capsule without breaking the radioactivity confinement. The capsule easily fits onto a microscope stage (Figure 1) and the measurement can be carried out through a standard optical window. Note that this capsule is not reusable but could be designed to be. The only limitation is the need for a long focal objective (1 cm or more). This technique presents several advantages compared to custom nuclearised instruments. The first is the possibility to use the full capacity of the instrument. This includes for example the use of:
- a double subtractive system for the measurement of Stokes and anti-Stokes spectra down to very low wavelength (< 10 cm–1);
- a triple additive mode for very high-resolution measurements (spectral resolution down to about 0.3 cm–1)
- as many excitation wavelengths as needed, whereas each remote head is configured for only one wavelength;
- the polarisation features of the instrument; the different modes of the instrument (microscope, macro), the autofocus, the confocal microscope function, the mapping/imaging functions).
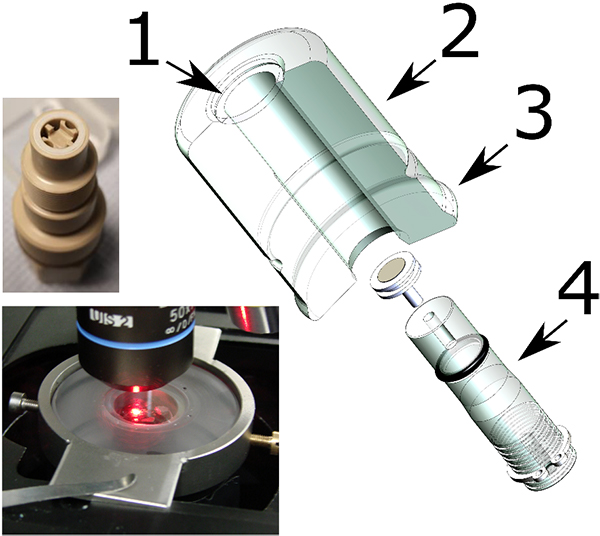
Figure 1. Compact confinement for Raman investigation of nuclear material. 1: optical window, 2: acrylic glass cylinder capsule. 3: flange for the fixation of the plastic bag tunnel. 4: movable sample support. Down left the confinement installed under a microscope. Up left: movable sample support for fluid-cell Raman spectroscopy.
The second advantage is the easy maintenance of the instrument that will stay free of contamination. The encapsulation technique also provides the possibility to easily implement measurements of samples under vacuum, pressure, chosen atmosphere or in liquids. Finally, the use of a Raman microscope drastically reduces the amount of material needed for the analysis. A sample of about 0.1 mm3 (~1 mg of actinide compounds) is largely sufficient for such a kind of Raman measurement. Handling such low quantities has the advantage that the radiation dose remains low.
The following paragraphs report some relevant and recent examples of scientific and technological applications of Raman spectroscopy in the nuclear field using the benefits of a flexible instrumentation.
Raman spectra of the actinide dioxides
The actinide dioxides are key materials in the nuclear fuel cycle. UO2 is the most common fuel of nuclear reactors. ThO2 is a well-known by-product of rare-earth mining, and is considered an alternative fuel material, although it is not fissile but fertile. PuO2 is produced in nuclear reactors and separated in some countries for re-use in mixed oxide (MOX) fuel.
The actinide dioxides have the general composition AnO2 and form a cubic fluorite-type crystal lattice. In this structure the most intense Raman signal is the T2g band, which occurs for UO2 at 445 cm–1. T2g corresponds to the asymmetrical O–U stretching vibration of the face-centred cubic crystal unit. Also, the other actinide dioxides have been measured and Figure 2a shows that the T2g peaks vary regularly within the series, indicating clearly the dependence on the mass of the actinide and thus the energy of the An–O interatomic vibration.
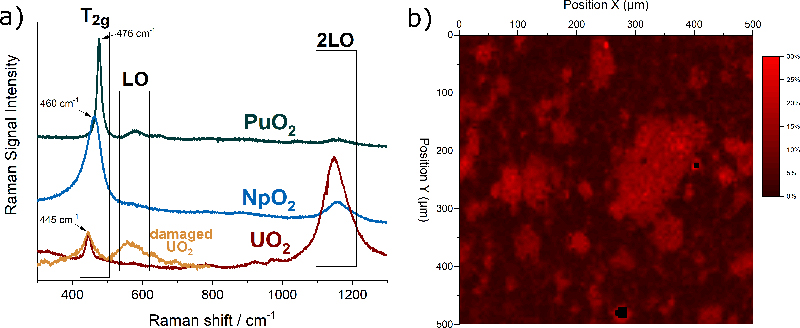
Figure 2. (a) Typical Raman spectra of UO2, NpO2 and PuO2 with the characteristic bands T2g, LO, 2LO. In orange, the spectrum of radiation-damaged UO2 doped with 241Am. (b) Raman map of the surface of the section of a MOX pellet indicating the concentration of Pu in U + Pu.
In addition to the interatomic vibrations, characteristic electronic transitions can also be observed by Raman spectroscopy, as shown in recent publications by Naji5 and Villa-Aleman.4 In these studies, the Raman spectra of NpO2 and PuO2 were measured using multiple excitation wavelengths and laser excitation heating where temperature was measured by the Stokes/anti-Stokes ratio. Naji performed those measurements on a fragment of a nuclear fuel pellet. Villa-Aleman reported an original study on as-fabricated PuO2, namely with a very different material morphology consisting of long-square stick-shaped crystallites. It was demonstrated that additional bands arise from the coupling of phonon and electronic transitions originating from the crystal field splitting of the degenerate ground states of the 5fn electron configurations.
Matrix defects in crystalline materials, such as the one produced by stoichiometry deviation, impurities or radiation damage, also influence the spectrum. For example, Figure 2a shows in orange the spectrum of UO2 doped with 5 % americium (241Am). The brightening of the T2g is an indication of the presence of defects in the matrix. Alpha-particles produced by the alpha decay of americium have a high energy and deposit it in a small volume of the material leading to atomic displacements and oxygen and uranium Frenkel pairs, with slightly different interatomic distances and forces resulting in the observed brightening.
These detailed analyses give a sound basis for the identification and characterisation of actinide oxides materials in applications like fresh fuel characterisation, irradiation damages in fuel, nuclear forensic and nuclear safeguards.
Distribution of plutonium in MOX nuclear fuel
Worldwide about 5 % of the nuclear fuel used in nuclear reactors is MOX fuel. It consists of plutonium-239 (239Pu) as the fissile element instead of uranium-235 (235U) and is mixed with natural or depleted uranium. It targets the re-use of separated plutonium from the recycling of standard UO2 fuels and can be used for the burning of excess plutonium from dismantled nuclear weapons. It has advantages in terms of proliferation, as the resulting spent fuel has a Pu isotopic composition that cannot be used for fabrication of weapons. It has also the advantage of reducing the consumption of enriched uranium. For industrialisation process optimisation reasons, the standard MOX is made from a blend of about 70 wt % of UO2 and 30 wt % of a (U0.70Pu0.30)O2 powder that is sintered to fuel pellets. This results in a fuel consisting of a UO2 matrix containing islands of plutonium-rich areas. The fission and thus the heat production will occur particularly in those islands. Therefore, quality control is required to assure that the distribution of the plutonium-rich areas is homogeneous in the fuel.
The PuO2 distribution in MOX fuel is generally measured by electron probe microanalysis (EPMA), which is an effective technique, although quite expensive and cumbersome. Samples must be carefully prepared for EPMA analysis, and dedicated radioactive hot cells or nuclearised instruments are needed.
Raman detection of the plutonium distribution in MOX fuel would present considerable advantages. Thanks to the possibility of remote measurements through a window, integration of this technique in the production line could be considered without major adaptations.6 An experimental demonstration of the feasibility of such measurement has been undertaken at JRC Karlsruhe. The analysis is based on the fact that when some of uranium atoms in the UO2 crystal are replaced by plutonium atoms, the T2g band shifts in a regular way towards higher frequencies7 up to those of pure PuO2 near 476 cm–1. This permits unknown PuO2 concentrations to be obtained from a measured Raman spectrum after correlating concentration and band position in a calibration curve.
A two-dimensional Raman map of the surface of a MOX pellet is shown in Figure 2b. The sample was measured in an alpha-confinement capsule with a standard Raman spectrometer. The false colour scale of the map corresponds to the position of the T2g band at a given position. A T2g band at 445 cm–1 corresponds to zero % of Pu in U + Pu (in black), and a band at 455 cm–1 corresponds to 30 % of Pu in U + Pu (in red). The map clearly reveals the areas enriched in plutonium.
In principle, this example demonstrates the feasibility of using Raman spectroscopy for the purpose of checking the conformity of the distribution of the plutonium in the fuel. Measurements can be performed with minimal sample preparation and at lower cost than EPMA. In principle, this technology enables increasing the throughput of the measured samples and thus a more comprehensive quality control.
PuO2 in nuclear waste glasses
Borosilicate glasses are broadly used for the immobilisation of high-level waste from reprocessing of used nuclear fuel. The glass immobilises the waste stream containing unfissioned and undissolved fuel residues, fission products and minor actinides (Np, Am, Cm). It can also be used to immobilise low-quality plutonium. However, the precipitation of crystalline secondary phases from the glass matrix containing fissile isotopes should be avoided, as it may present issues related to the stability of the material in a nuclear repository.
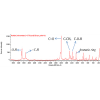
Raman spectroscopy has been demonstrated8 to be suited for the detection of crystalline plutonium dioxide in sodium borosilicate glasses. Glasses produced at JRC Karlsruhe to simulate the behaviour of high-Pu nuclear waste vitrification matrices were analysed. The precipitation of PuO2 crystallites from the vitreous glass matrix was observed when the plutonium concentration exceeded a certain value (Figure 3), indicating that the solubility limit of plutonium dioxide in the glass had been exceeded. In this case, Raman spectroscopy helped to efficiently, quickly and non-invasively detect the precipitation of PuO2 micro-crystallites when the solubility limit was reached. Moreover, the results from a recent Raman spectroscopy study of PuO2 nano-crystals9 can further be used to detect the early nucleation of crystalline plutonium dioxide nano-crystallites.
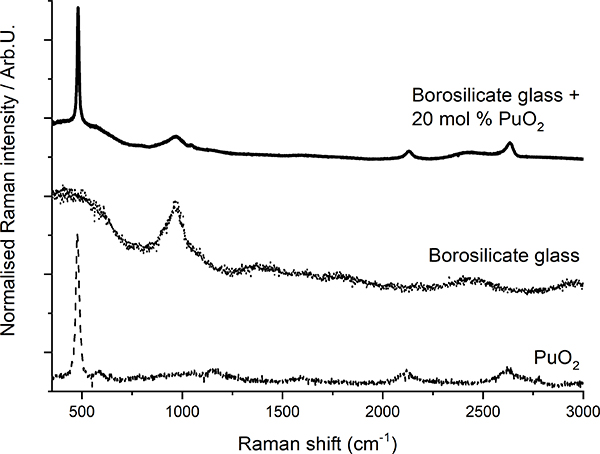
Figure 3. Plot of Raman spectra of borosilicate glass, PuO2 and borosilicate glass with PuO2 inclusions (after Reference 8).
Fluid-cell Raman spectroscopy for the in situ and real-time study of the aqueous alteration behaviour of Chernobyl “lava”
During the nuclear accident at the Fourth Unit of the Chernobyl Nuclear Power Plant in 1986, the interaction between heated UO2 fuel rods and fuel cladding with silicate materials of the reactor (concrete and serpentine) led to the formation of a highly radioactive silicate melt, the so-called Chernobyl “lava” that penetrated into different reactor compartments and solidified.10 In 1990, scientists of the V.G. Khlopin Radium Institute personally collected samples inside the sarcophagus, that was built to cover the nuclear reactor, and observed the formation of secondary uranium phases [e.g., UO2 · H2O; UO3 · 2H2O; Na4(UO2)(CO3)] on the surface of Chernobyl “lava”, providing evidence for the ongoing chemical alteration of Chernobyl “lava”.10
In order to study the effects of aqueous corrosion on this highly radioactive material by infiltrating water, the capsule for radioactive samples developed at JRC was adapted by replacing the sample holder by a fluid-cell containing a black Chernobyl “lava” sample immerged in an alkaline sodium carbonate solution (Figure 4).
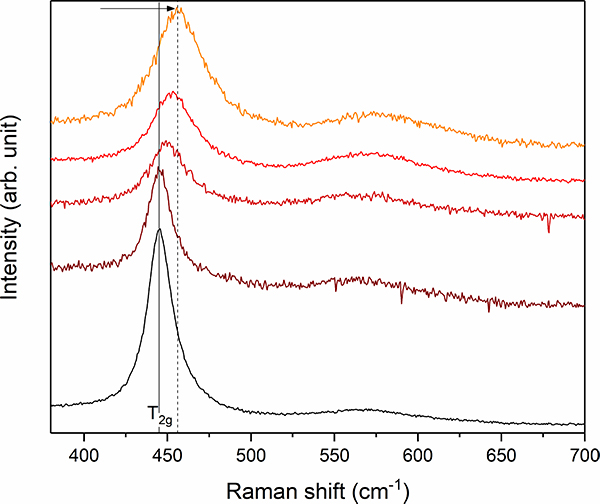
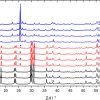
Figure 4. Stacked plot of Raman spectra between 350 cm–1 and 700 cm–1 from different UO2 + x inclusions of the black Chernobyl “lava”. Note the frequency shift and simultaneous band broadening of the T2g mode from 445 cm–1 (marked by grey solid line) up to 456 cm–1 (grey dashed line) indicating the existence of hyper-stoichiometric UO2 + x.
Before the experiment, the black Chernobyl “lava” was investigated by EPMA and Raman spectroscopy. These analyses revealed that the Chernobyl “lava” consists of various inclusions of uranium and zirconium phases (UO2 + x, UOx + Zr, Zr–U–O, (Zr,U)SiO4 and (Zr,U)O2), quartz sand, as well as Fe-bearing steel spheres, which are embedded by in a metaluminous silicate glass.
For the very first in situ Raman corrosion experiment,11 a sample of black “lava” was mounted in the fluid-cell and immersed in a sodium carbonate solution (Na2CO3; pH ≈ 11.8). This solution was chosen to simulate the alkaline conditions inside the sarcophagus. The Raman capsule with the integrated fluid-cell was then placed on an automated x,y,z stage, which allowed the acquisition of 2D Raman maps of the area of interest. This area involved an inclusion of uranium oxide and smaller metallic steel spheres, which were surrounded by the glassy matrix.
Raman mapping of the area of interest was repeated approximately every 48 h for a total duration of two months. Within the first 28 days, significant changes in the Raman spectra were observed. Although some new bands remain unidentified, the appearance of two intensive bands point to the formation of a yet unidentified secondary phase that precipitated and grew from solution. The results of this work demonstrate the feasibility of extended kinetic analysis of reactions between radioactive materials and aqueous solutions. As recently been shown for non-radioactive glasses,12 this technique opens up new avenues to study the interaction of nuclear materials and aqueous solutions by Raman spectroscopy with the ability to study specific sub-processes in situ and in real time.
Outlook
Thanks to the high flexibility of the Raman spectroscopy technique, the number of studies performed on nuclear materials of many different types and applications has increased impressively in the last fifteen years and moved into applied fields such as nuclear safeguards, decommissioning and process control. Its wider technological application requires a fundamental understanding of the spectra of the materials employed in the nuclear fuel cycle, but also in non-electric applications, such as space power or radioisotope production. In addition to establishing reference spectra for these radioactive materials, one also needs to understand the effects of radiation damage on the spectra and peculiar effects resulting from the unique electronic configuration of the actinides.
References
- G.M. Begun, R.G. Haire, W.R. Wilmarth and J.R. Peterson, “Raman spectra of some actinide dioxides and of EuF2”, J. Less-Common Metals 162, 129 (1990). https://doi.org/10.1016/0022-5088(90)90465-V
- G. Guimbretière, L. Desgranges, C. Jegou, A. Canizarès, P. Simon, R. Caraballo, N. Raimboux, M. Barthe, M. Ammar, O.A. Maslova, F. Duval and R. Omnée, “Characterization of nuclear materials in extreme conditions: The Raman spectroscopy approach”, 2013 3rd International Conference on Advancements in Nuclear Instrumentation, Measurement Methods and their Applications (ANIMMA), pp. 1–8 (2013). https://doi.org/10.1109/ANIMMA.2013.6727957.1109/ANIMMA.2013.6727957
- J.-Y. Colle, M. Naji, M. Sierig and D. Manara, “A novel technique for Raman analysis of highly radioactive samples using any standard micro-Raman spectrometer”, JoVE 122, e54889 (2017). https://doi.org/10.3791/54889
- E. Villa-Aleman, N.J. Bridges, T.C. Shehee and A.L. Houk, “Raman microspectroscopy of PuO2 particulate aggregates”, J. Nucl. Mater. 515, 140–149 (2019). https://doi.org/10.1016/j.jnucmat.2018.12.022
- M. Naji, N. Magnani, L.J. Bonales, S. Mastromarino, J.Y. Colle, J. Cobos and D. Manara, “Raman spectrum of plutonium dioxide: vibrational and crystal field modes”, Phys. Rev. B 95(10), 104307 (2017). https://doi.org/10.1103/PhysRevB.95.104307
- Z. Talip, S. Peuget, M. Magnin, M. Tribet, C. Valot, R. Vauchy and C. Jégou, “Characterization of un-irradiated MIMAS MOX fuel by Raman spectroscopy and EPMA”, J. Nucl. Mater. 499, 88–97 (2018). https://doi.org/10.1016/j.jnucmat.2017.11.014
- R. Böhler, M.J. Welland, D. Prieur, P. Cakir, T. Vitova, T. Pruessmann, I. Pidchenko, C. Hennig, C. Guéneau, R.J.M. Konings and D. Manara, “Recent advances in the study of the UO2–PuO2 phase diagram at high temperatures”, J. Nucl. Mater. 448(1), 330–339 (2014). https://doi.org/10.1016/j.jnucmat.2014.02.029
- D. Manara, M. Naji, S. Mastromarino, J.M. Elorrieta, N. Magnani, L. Martel and J.Y. Colle, “The Raman fingerprint of plutonium dioxide: Some example applications for the detection of PuO2 in host matrices”, J. Nucl. Mater. 499, 268–271 (2018). https://doi.org/10.1016/j.jnucmat.2017.11.042
- D. Hudry, C. Apostolidis, O. Walter, A. Janßen, D. Manara, J.-C. Griveau, E. Colineau, T. Vitova, T. Prüßmann, D. Wang, C. Kübel and D. Meyer, “Ultra-small plutonium oxide nanocrystals: an innovative material in plutonium science”, Chem.-Eur. J. 20(33), 10431–10438 (2014). https://doi.org/10.1002/chem.201402008
- B.E. Burakov, E.B. Anderson, S.I. Shabalev, E.E. Strykanova, S.V. Ushakov, M. Trotabas, J.Y. Blanc, P. Winter and J. Duco, “The behavior of nuclear fuel in first days of the Chernobyl accident”, MRS Proceedings 465, 1297 (2012). https://doi.org/10.1557/PROC-465-1297
- M.I. Lönartz, First in situ Observations of the Alteration Behaviour of Chernobyl Lava by Fluid-Cell Raman Spectroscopy. Steinmann-Institut für Geowissenschaften der Rheinischen Friedrich-Wilhelms-Universität Bonn (2019).
- T. Geisler, L. Dohmen, C. Lenting and M.B.K. Fritzsche, “Real-time in situ observations of reaction and transport phenomena during silicate glass corrosion by fluid-cell Raman spectroscopy”, Nat. Materials 18(4), 342–348 (2019). https://doi.org/10.1038/s41563-019-0293-8